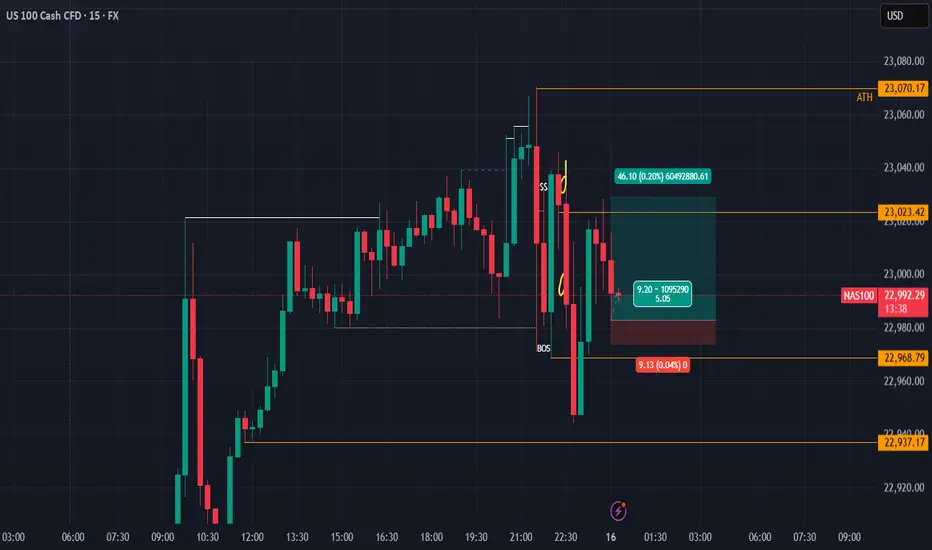
NQ Buy within range The overall trend is ranging, but the price recently created a new ATH and now it seem to be grabbing liquidity. With that, we can expect the price to continue pushing up to at least grab the liquidity above 23029.47.
NDQ trade ideas
US consumer sentiment improved in Jun could boost US indices The US July Michigan Consumer Sentiment Index increased to 61.8 from 60.7, while the 12-month inflation expectation decreased to 3.6% from 4% in the previous month. This suggests an easing of inflation concerns and improved consumption optimism.
This data, coupled with recent stronger Retail Sales figures, continues to support expectations for robust US economic growth amidst trade tariff uncertainties. Inflation is anticipated to have a limited short-term impact. Concurrently, the approval for AMD and Nvidia (NVDA) to export AI chips to China further bolsters the US tech sector.
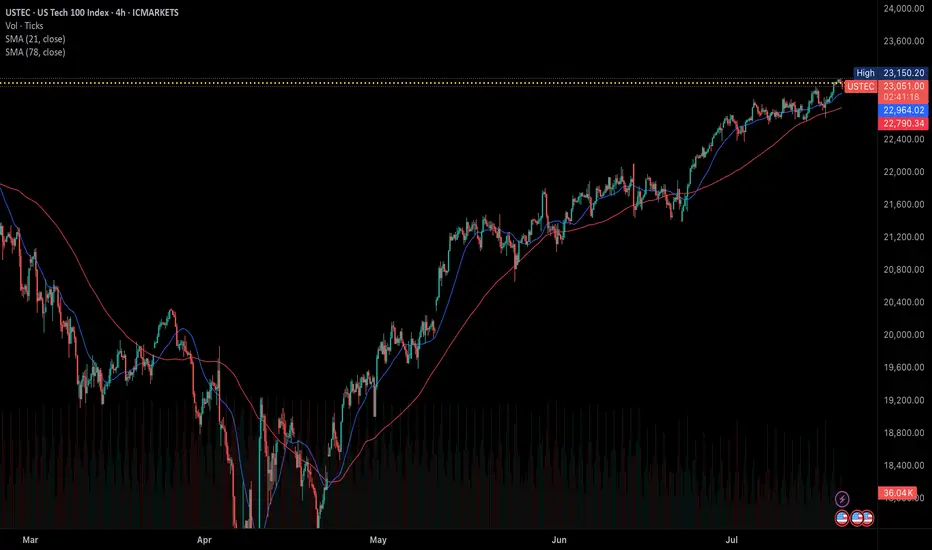
The USTEC is currently in an upward trend, having reached a new high before a slight retreat. It is trading above both the EMA21 and EMA78, indicating higher highs and higher lows, suggesting the rally could persist.
Should the USTEC continue its surge, the index may test the resistance level at 23,200. Conversely, a failure to maintain above the trendline could trigger a decline towards the next support at 22,600.
By Van Ha Trinh - Financial Market Strategist from Exness
NASDAQ ShortLooking forward to this Setup dropping back down to attent to low of the day as the New york session approaches, Looking to take profit before 15:00 Central African Time
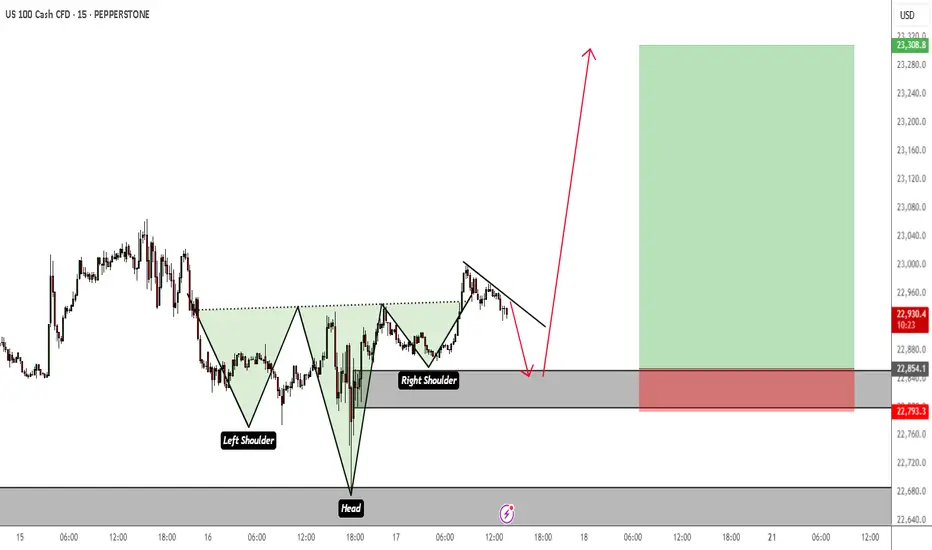
NASDAQ Inverted Head & Shoulders Retest Before Bullish MomentumI see a possible retest of an Inverted Head and Shoulders on M15 TF before the bullish momentum resumes. The SL and TP are just a rough estimation. Price could dip a bit lower than that.
But my overall bias is bullish.
NAS100 Is Very Bullish! Long!
Take a look at our analysis for NAS100.
Time Frame: 12h
Current Trend: Bullish
Sentiment: Oversold (based on 7-period RSI)
Forecast: Bullish
The market is on a crucial zone of demand 23,006.9.
The oversold market condition in a combination with key structure gives us a relatively strong bullish signal with goal 23,667.5 level.
P.S
Overbought describes a period of time where there has been a significant and consistent upward move in price over a period of time without much pullback.
Disclosure: I am part of Trade Nation's Influencer program and receive a monthly fee for using their TradingView charts in my analysis.
Like and subscribe and comment my ideas if you enjoy them!

NAS100 formed a bullish Flag Wait for Breakout NAS100 has recently formed a Flag pattern and price is currently consolidating in the flag channel(box) pattern and wait for the breakout can easily take the price to 23500-23600.

NASDAQ 100: AI Momentum and Resilient Earnings Drive New HighsThe NASDAQ 100 continues its strong uptrend 📈, recently breaking to new highs after a period of consolidation. The rally is broad-based but remains led by heavyweight tech names and AI-related stocks 🤖.
Key Fundamental Drivers:
AI & Tech Growth 🤖💡: The biggest catalyst is the ongoing boom in artificial intelligence and digital transformation. Companies in the index, especially the “Magnificent Seven” (like NVIDIA, Microsoft, Apple), are seeing robust earnings growth and strong investor demand for AI exposure. Global IT spending is projected to grow by over 9% in 2025, with AI spending up nearly 30% year-on-year.
Earnings Resilience 💪💰: Despite high interest rates and inflation, tech companies have adapted well, maintaining strong margins and growth. The sector is expected to remain a top performer through 2025.
Fed Policy & Rate Expectations 🏦🔮: Markets are increasingly pricing in a pause or even cuts in US interest rates later in 2025, which is bullish for growth stocks and tech-heavy indices like the NASDAQ 100.
Geopolitical & Macro Factors:
Reduced Uncertainty 🌏🕊️: The market has absorbed major geopolitical shocks (such as the Israel-Iran conflict and US-China trade tensions), and the resolution or de-escalation of these risks has reduced uncertainty, supporting risk assets.
US Election & Policy 🇺🇸🗳️: The outcome of the US election and expectations for stable or pro-business policies have also contributed to positive sentiment.
Global Supply Chains & Resilience 🌐🔗: While some risks remain (e.g., cyber threats, regulatory changes, and supply chain disruptions), the tech sector’s global reach and adaptability have helped it weather these challenges.
Why is it rallying now?
AI optimism and strong tech earnings are the main drivers 🤖💹.
Expectations of easier Fed policy and a resilient US economy are fueling risk appetite 🏦📈.
Geopolitical risks have eased or are being priced in, allowing investors to focus on growth 🌍🕊️.
Summary:
The NASDAQ 100’s rally is powered by AI-driven tech growth 🤖, resilient earnings 💪, and easing macro/geopolitical risks 🌏. The index remains a global leader as investors bet on the next wave of technology and digital innovation 🚀.

#NDQ - Weekly Targets 23197.39 or 21886.08 ?Date: 03-07-2025
#NDQ - Current Price: 22641.89
Pivot Point: 22541.74 Support: 22335.83 Resistance: 22748.58
#NDQ Upside Targets:
Target 1: 22832.49
Target 2: 22916.40
Target 3: 23056.89
Target 4: 23197.39
#NDQ Downside Targets:
Target 1: 22251.45
Target 2: 22167.08
Target 3: 22026.58
Target 4: 21886.08

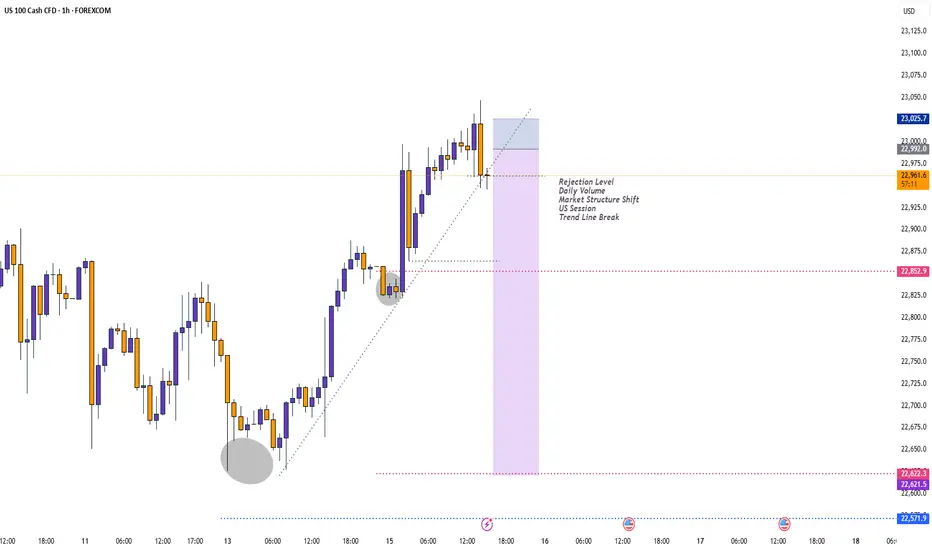
BUYRejection Level
Daily Volume
Market Structure Shift
London Session
Trend Line Break
Untapped Order Point

Trade, Fed, and Policy Developments Impacting NASDAQ 100Tariff Expansion Threat:
Donald Trump signaled upcoming tariffs on pharmaceuticals and semiconductors, two sectors heavily represented in the NASDAQ 100. These measures could:
Raise consumer costs.
Disrupt tech and healthcare supply chains.
Add margin pressure on multinational firms.
Corporate Impact:
Rio Tinto revealed $300M in losses from US aluminum tariffs on Canadian output.
Canada-US trade talks will intensify, but tariffs appear likely to remain, adding to cost overhang for manufacturers and downstream users.
Fed Leadership Uncertainty:
Kevin Hassett is emerging as the frontrunner to replace Fed Chair Jerome Powell in 2026.
Trump is critical of Powell, even citing Fed building renovation costs as a potential fireable offense.
This adds uncertainty to monetary policy continuity, especially as inflation rises and rate path expectations diverge.
401(k) and Private Equity Access:
The administration is finalizing an executive order allowing 401(k) plans to invest in private equity, a move that could:
Increase alternative asset exposure.
Boost private market valuations.
Signal a policy tilt toward financial market liberalization, which may help sustain risk sentiment in the medium term.
Conclusion for NASDAQ 100 (NSDQ100) Trading
The near-term risk for NASDAQ 100 is tilted negative due to the tariff threats on semiconductors and pharma, both major index components.
Fed leadership uncertainty could inject volatility into rate expectations, pressuring tech valuations sensitive to discount rate changes.
However, the longer-term policy shift toward broader 401(k) access to private markets could support overall market sentiment and capital flows.
Bias: Cautiously Bearish in the short term due to trade and Fed risks; neutral to slightly bullish medium term if private capital access reforms proceed and trade escalation is contained.
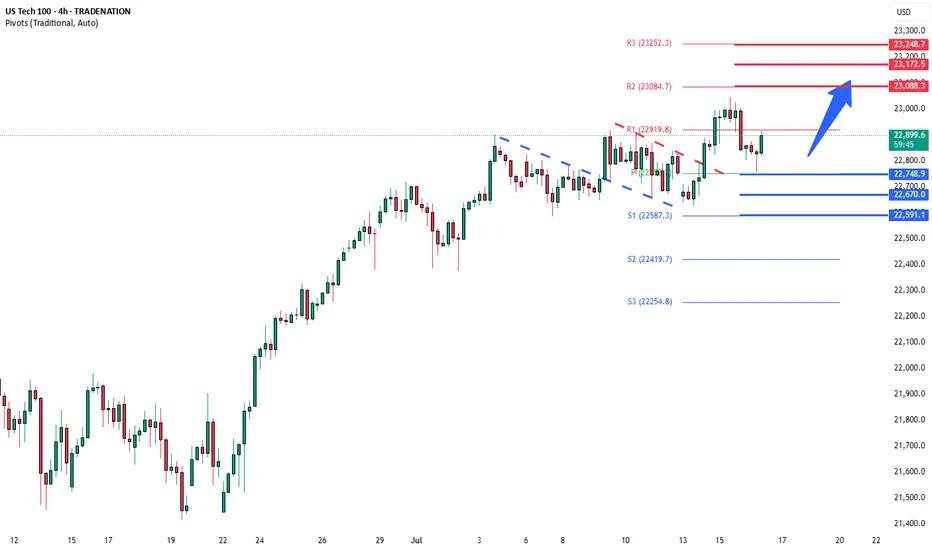
Key Support and Resistance Levels
Resistance Level 1: 23080
Resistance Level 2: 23170
Resistance Level 3: 23250
Support Level 1: 22750
Support Level 2: 22670
Support Level 3: 22590
This communication is for informational purposes only and should not be viewed as any form of recommendation as to a particular course of action or as investment advice. It is not intended as an offer or solicitation for the purchase or sale of any financial instrument or as an official confirmation of any transaction. Opinions, estimates and assumptions expressed herein are made as of the date of this communication and are subject to change without notice. This communication has been prepared based upon information, including market prices, data and other information, believed to be reliable; however, Trade Nation does not warrant its completeness or accuracy. All market prices and market data contained in or attached to this communication are indicative and subject to change without notice.
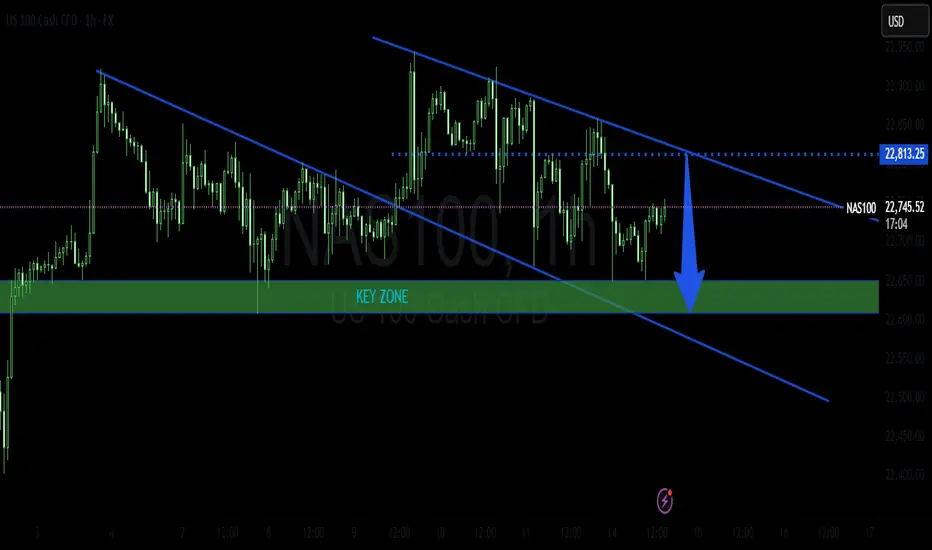
NASDAQ Potential DownsidesHey Traders, in today's trading we are monitoring NAS100 for a selling opportunity around 22,800 zone, NASDAQ is trading in a downtrend and currently is in a correction phase in which it is approaching the trend at 22,800 support and resistance area.
Trade safe, Joe.

NASDAQ At Good Res , Is It A Chance To Sell To Get 200 Pips ?Here is my 4H Nasdaq Chart and my opinion is the price at very interesting selling area for me , this Res Area forced the prices to go down 2 times and i think this third time will be the best one , so i`m waiting the price to go up a little to retest the res one more time and then we can enter a sell trade and targeting from 100 to 200 pips . the only reason to cancel this idea if we have a clear daily closure above my res area .

US100 (Nasdaq 100) - Future Outlook (as of mid-July 2025)The US100, which is heavily concentrated in technology and growth companies, has been a significant driver of overall market performance in recent times. Its future trajectory is intricately linked to a combination of macroeconomic trends, corporate earnings, and evolving technological narratives.
Key Factors Shaping the Outlook:
Monetary Policy and Inflation Dynamics:
Cooling Inflation: If inflation continues to moderate (as indicated by CPI, PCE, and other economic data), central banks, particularly the U.S. Federal Reserve, will have more flexibility to consider easing monetary policy.
Interest Rate Expectations: Lower interest rates are generally a boon for growth stocks. They reduce the cost of borrowing for companies and increase the present value of their future earnings, which makes their (often higher) valuations more palatable. Conversely, any resurgence in inflation that forces a "higher for longer" interest rate stance could put significant downward pressure on the US100. As of mid-2025, the market has largely priced in the expectation of potential rate cuts later in 2025 or early 2026, but this remains highly data-dependent and subject to change with each new economic report.
C orporate Earnings and AI Enthusiasm:
Tech Earnings Season: The performance of the major tech titans within the Nasdaq 100 (e.g., Apple, Microsoft, Amazon, Google, Nvidia, Meta, Tesla) during their quarterly earnings reports will be critical. Continued strong earnings beats, particularly from companies that are leading the charge in Artificial Intelligence (AI), will reinforce investor confidence and support higher valuations.
Artificial Intelligence (AI) Narrative: The intense excitement and significant investment surrounding AI remain a powerful tailwind for the US100. Companies demonstrating clear pathways to monetize AI, or those establishing dominant positions in AI infrastructure and applications, are likely to continue seeing robust performance. However, any signs of the AI narrative losing steam, or a perception of an AI "bubble," could trigger profit-taking or a broader market correction.
Economic Growth and Consumer Behavior:
U.S. Economic Health: A resilient U.S. economy, characterized by healthy GDP growth and a strong labor market, provides a conducive environment for corporate revenues. A "soft landing" scenario (where inflation is tamed without triggering a recession) is the most favorable outcome for the US100.
Consumer Spending: Strong consumer confidence and sustained spending directly benefit sectors like e-commerce, software services, and consumer electronics, which are heavily represented in the Nasdaq 100.
Valuation Considerations:
While many Nasdaq 100 companies have delivered impressive earnings growth, their valuations (e.g., P/E ratios) are, for some, elevated compared to historical averages. This implies that there might be less margin for error in future earnings reports or unexpected shifts in the economic landscape. A "valuation reset" could occur if growth projections fail to materialize or if interest rates remain higher than currently anticipated.
Geopolitical and Global Factors:
Global Trade & Geopolitics: Ongoing global trade dynamics, geopolitical tensions (e.g., US-China relations, regional conflicts), and potential supply chain disruptions can introduce unforeseen volatility and impact global economic growth, which, in turn, affects the predominantly international-facing tech sector.
Overall Future Outlook (from a mid-July 2025 perspective):
The US100's future outlook appears cautiously optimistic, primarily driven by the enduring strength of underlying technology trends and the transformative potential of AI. The index has demonstrated remarkable resilience and continues to be favored by growth-oriented investors.
Upside Potential: Could be fueled by sustained strong earnings from its tech giants, especially those leading in AI, coupled with clear indications of forthcoming interest rate cuts.
Downside Risks: The index remains highly susceptible to shifts in interest rate expectations (e.g., if inflation proves stickier than anticipated), any disappointments in high-profile tech earnings, or a broader economic downturn. Given its concentration in high-growth, high-beta stocks, the US100 is prone to more significant fluctuations in both upward and downward market moves compared to broader, more diversified indices.
Investors and traders will be closely monitoring key economic data (inflation, employment), central bank communications, and the performance of bellwether tech companies for crucial clues about the index's direction.
⚠️ Disclaimer: This post is educational content and does not constitute investment advice, financial advice, or trading recommendations. The views expressed here are based on technical analysis and are shared solely for informational purposes. The stock market is subject to risks, including capital loss, and readers should exercise due diligence before investing. We do not take responsibility for decisions made based on this content. Consult a certified financial advisor for personalized guidance
For those interested in further developing their trading skills based on these types of analyses, consider exploring the mentoring program offered by Shunya Trade.
I welcome your feedback on this analysis, as it will inform and enhance my future work

[BUY] Bullish ORDERBLOCK Demand ZoneBreak of structure at the daily creating a higher high
Entered longs at the demandzone/orderblock as highlighted.
SL at daily support (higher low)
Target recent highs at 22,920
COT data indicates that last week, institutions continued to buy NASDAQ heavily.


NAS100 Setup Locked In — Ride the Drop from the Order Block!Hey Guys,
I'm planning a sell trade on the NAS100 index from a designated order block. Once price reaches the sell zone, the position will be activated.
📍 Trade Details:
- 🟢 Entry Level: 22,869
- 🔴 Stop Loss: 22,930
- 🎯 TP1 – First Target: 22,839
- 🎯 TP2 – Second Target: 22,794
- 🎯 TP3 – Final Target: 22,671
📐 Risk-to-Reward Ratio: 3.24
Your likes and support are what keep me motivated to share these analyses consistently.
Huge thanks to everyone who shows love and appreciation! 🙏

NASDAQ SHORT TRADE PLANThe instrument is trading inside a descending wedge pattern. This pattern has been respected for some time now and I believe it will continue to play.
Please do your own analysis before placing any trades.
Cheers and Happy Trading !!!!
NASDAQ at Risk – Tariffs Pressure Tech IndexUSNAS100 – Market Outlook
The index is currently in a sensitive zone, heavily influenced by ongoing tariff tensions. If the current geopolitical pressure continues, it may fuel bearish momentum across the tech-heavy index.
To regain a bullish outlook, we need to see signs of negotiation or de-escalation, which could stabilize the price and lead it toward 23010 and 23170.
However, as of today, the market appears to be setting up for a correction, potentially dipping to 22815, followed by a deeper bearish move targeting 22420.
Support Levels: 22615 – 22420
Resistance Levels: 22905 – 23010

NAS100 Nasdaq Range-Bound: What Traders Should Watch Next US100I'm currently keeping a close eye on the Nasdaq 🧠📊, which is trading within a range-bound structure 📉📈. While we’re seeing some bullish momentum on the NAS100 4-hour chart today ⏱️📈, it’s nothing particularly strong or decisive just yet. I’m waiting for a clear break 🔓 either above or below this current range before considering any trading opportunities 🎯.
In this US100 chart 🖼️, I’ve highlighted key components such as price action, market structure, the prevailing trend, and other important elements of technical analysis 🧩📐.
⚠️ Please remember: this is a market analysis and reflects my personal opinion — not a trade recommendation. Always do your own due diligence 🕵️♂️ before making any trading decisions. This is not financial advice.

NASDAQ - Bullish BiasHTF Overview: 4H shows strong bullish intent with momentum driving price higher. Clear upside direction supported by sustained breaks in structure.
Liquidity Note: Noticed a key liquidity zone beneath current price (marked in blue). Although deeper mitigation was possible, price remained bullish.
MTF Refinement (30M): Dropped to the 30M for structural clarity and saw an earlier reaction. A bullish OB was formed and respected — now monitoring it for a potential mitigation.
LTF Execution Plan: If the 30M OB is revisited, I’ll be looking to the 1M/5M for confirmation (CHoCH or BOS) before executing long positions.
Mindset: Momentum is with the bulls — just waiting for smart money to confirm their next move.
Bless Trading!

"NASDAQ 100: THE TECH ROBBERY! – Quick Profits Before Reversal?"🔥 "The NDX NASDAQ 100 INDEX Heist: Bullish Loot & Escape Before the Trap!" 🔥
🌟 Hi! Hola! Ola! Bonjour! Hallo! Marhaba! 🌟
Dear Money Makers & Market Robbers, 🤑💰💸✈️
Based on the 🔥Thief Trading Style🔥 (technical + fundamental analysis), here’s our master plan to heist the NDX - NASDAQ 100 INDEX. Follow the strategy on the chart—long entry is the play! Aim to escape near the high-risk RED Zone (overbought, consolidation, potential reversal). The bears are lurking, so take profits and treat yourself—you’ve earned it! 💪🏆🎉
🚀Entry (The Vault is Open!)
"Swipe the bullish loot at any price!"
For precision, place buy limit orders within 15-30min timeframe (recent swing lows/highs).
Set alerts! Don’t miss the heist.
🛑 Stop Loss (Safety Net)
Thief-style SL at nearest swing low (4H timeframe) → 21,770.00 (adjust based on risk/lot size).
🏴☠️ Target 🎯: 22,800.00
Bullish momentum is fueling this heist—ride the wave but exit before the trap!
📰 Fundamental Backing (Why This Heist Works)
Macroeconomic trends, COT data, geopolitics, and sentiment align for bullish moves.
Full analysis? Check 👉🔗🌎
⚠️ Trading Alerts (News & Risk Mgmt)
Avoid new trades during high-impact news (volatility = danger).
Use trailing stops to lock profits and dodge sudden reversals.
💥 Boost This Heist!
Hit 👍 (Boost Button) to strengthen our robbery squad!
More heists = More profits—stay tuned for the next steal! 🚀🤑
See you soon, fellow thieves! 🤝🎉
