US 100 (NDQ) : Stay Heavy on PositionsApril Fear & Buy Signals
In early April, the Nasdaq 100 experienced a sharp sell-off, triggering extreme fear sentiment across the market.
At that point, scale-in buy signals appeared—classic "buy the fear" conditions.
Markets swing between greed and fear—unless the whole country collapses. Right now, greed is taking the lead, but the real blow-off top volatility hasn’t even started yet.
Stay Heavy on Positions
Despite short-term uncertainty, I’m maintaining an overweight position on the Nasdaq 100.
As long as we don’t see a major breakdown, the bias remains bullish.
NDQ trade ideas

NAS100 - Bullish Setup BuildingPair: NASDAQ (NAS100)
Bias: Bullish
HTF Overview: 1H structure holding bullish after recent break of internal highs. Price pulling back toward a key demand zone.
LTF Confirmation: Waiting for price to mitigate the 1H Order Block, then drop to lower timeframes (15M → 5M) for confirmation entries.
Entry Zone: Watching for bullish reaction within OB, ideally paired with inducement or liquidity sweep before shift.
Targets: Short-term target is the next 1H high — extended targets align with overall bullish momentum continuation.
Mindset Note: Patience over prediction. Let price tap into the zone and confirm — don’t chase, just position smart.
Bless Trading!
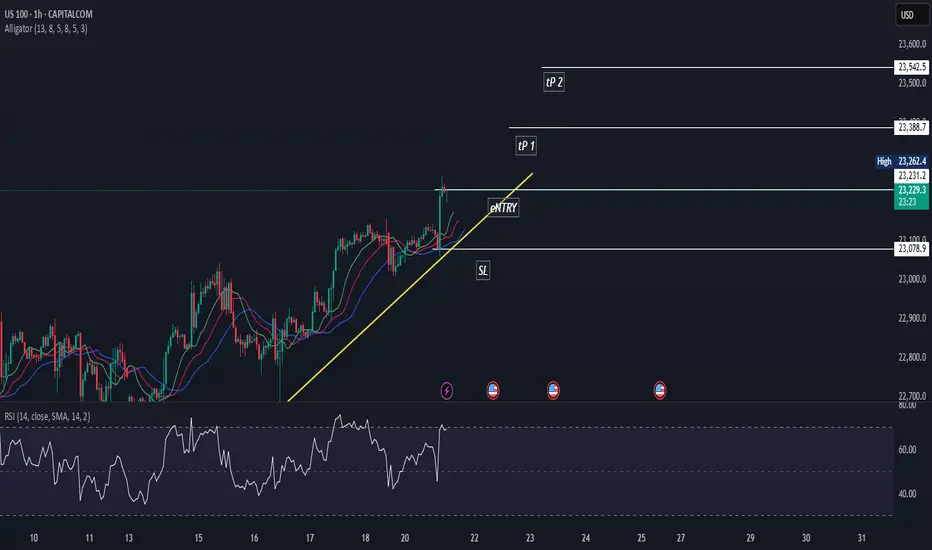
US100US100 is in strong bullish trend.
Alligator mouth is open which shows us trend will go further upward.
All sign shows that trend will continue.
We buy aT cmp.

NASDAQ (CASH100) SHORT - Double TOP H4Risk/reward = 11.3
Entry price = 23 190
Stop loss price = 23 270.4
Take profit level 1 (50%) = 22 674
Take profit level 2 (50%) = 22 053
All variables met, and entered the trade.
What is everyone's thoughts on shorting or longing cash100?
NAS100 - Stock Market Awaits Tariffs!The index is trading above the EMA200 and EMA50 on the 1-hour timeframe and is trading in its ascending channel. The target for this move will be the channel ceiling, but if it corrects towards the indicated support area, it is possible to buy Nasdaq with better reward to risk.
In a week once again clouded by trade tariff threats, the stock market reacted cautiously at times. However, what truly captured investors’ attention was growing concern over potential political interference in Federal Reserve policymaking—a development that influenced market sentiment and shifted the focus away from geopolitical tensions.
Despite political headwinds, U.S. economic data continued to show signs of resilience. Investors this week were more focused on corporate earnings and inflation data than on trade war rhetoric or speculation about Jerome Powell’s possible dismissal. While betting markets such as Polymarket raised the odds of Powell being removed to 40%, legally, the president cannot dismiss the Fed Chair without a valid cause—and allegations like “lying to Congress” lack legal standing.
Still, the greater danger lies not in Powell’s dismissal itself but in the potential erosion of the Federal Reserve’s independence—something that could unsettle investors in stocks, bonds, and currencies alike. Analysts expect Trump may soon appoint an ally as an informal or “shadow” Fed Chair, a move that would elevate political risk in financial markets.
Nevertheless, markets are continuing to operate along familiar lines: equities focus on corporate profits, the bond market on inflation and growth, and the currency market on relative returns. For now, the takeaway is clear: Trump is winning—but perhaps only temporarily.
Rick Rieder, Chief Investment Officer at BlackRock, noted that despite trade tensions and inflation concerns, tariffs have had limited impact so far. Following the June CPI report, he pointed out that inflation ticked up slightly—core CPI rose by 0.23% monthly and 2.93% annually, while headline inflation was up 0.29% monthly and 2.67% annually—but the broader trend still reflects easing price pressures.
Rieder attributed this to companies acting preemptively, managing inventory and adjusting supply chains to avoid passing on costs to consumers. He also cited easing wage pressures and a weakening labor market as factors contributing to the decline in inflation.
As such, Rieder believes the Federal Reserve might lower interest rates in September, though a cut in July is less likely, as the central bank would prefer to assess the impact of tariffs first.
According to the Wall Street Journal, Treasury Secretary Scott Besant privately urged Trump not to remove Jerome Powell. Besant warned that such an action could cause unnecessary turbulence in financial markets and the broader economy, and would also face legal and political hurdles. He emphasized that the Fed is already signaling potential rate cuts later this year, and confronting Powell now would be unwarranted.
A source noted that Besant reminded Trump the economy is performing well, and markets have responded positively to administration policies—another reason to avoid drastic moves.
On another front, rising long-term bond yields have become a concern for Besant, as they increase the government’s borrowing costs.He has been working to keep yields in check and believes firing Powell could further escalate them—hence his conversation with Trump aimed at dissuasion.
The coming week will begin with market attention on the European Central Bank’s rate decision, which could set the tone for Eurozone monetary policy in the second half of the year. Meanwhile, a series of key U.S. economic data will be released, providing a clearer view of conditions in employment, production, and housing.
On Tuesday, Jerome Powell will deliver an opening speech at an official event in Washington. While he is unlikely to directly address Trump’s recent verbal attacks, investors will be listening closely for any subtle references to Fed independence or interest rate direction.
On Wednesday, the June existing home sales report will be released, which could indicate whether housing demand remains steady or is weakening.
Thursday will be a packed day on the economic calendar. The ECB’s rate decision will be announced—an event under heavy scrutiny amid Eurozone stagnation. In the U.S., preliminary PMI data from S&P, weekly jobless claims, and new home sales will also be published.
Finally, the week will wrap up on Friday with the release of U.S. durable goods orders—an important gauge of capital investment in the manufacturing sector.

A very ambitious LONG I have entered LONG on nas100 once it retested the break of the double top.
No BS, just a simple trade... no spider webs on the screen, no crazy, imaginary strategy..
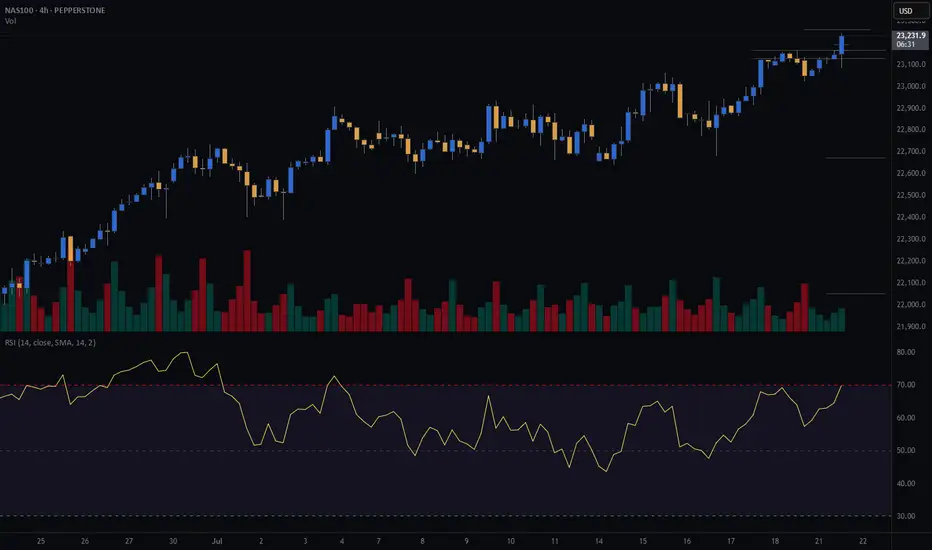
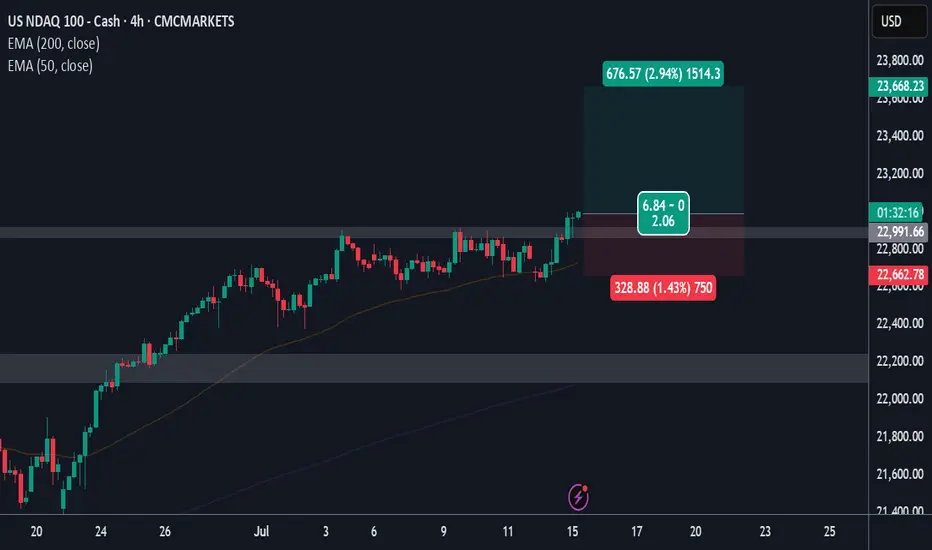
Nas100• Daily: Price is nearing the upper boundary of a rising wedge pattern — showing signs of overextension.
• 4H: Strong bullish structure with clean breaks and retests of minor consolidation ranges.
• 1H: Small range developing after recent high. A deeper pullback to 22,960–22,880 would offer a cleaner entry for continuation.
⚠️ Watch For:
• Wedge resistance on the daily chart.
• Bullish continuation only valid above 23,040.
• If we break below the 4H support zone (around 22,880), short-term pullbacks are likely.
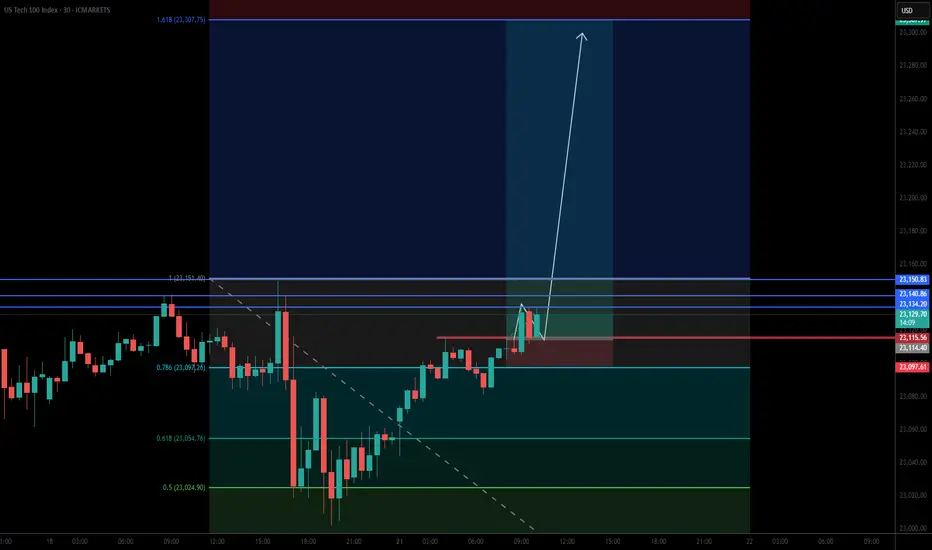
7/21/25 ((NAS100)) analysisPrice is definitely going up
may come down to quickly tap the daily FVG first
perhaps in the beginning of the week
---Monday/Tuesday style but not married to that Idea
could also come back to hit that volume weekly line thing
I just decided to implement lol who knows
anyways I plan to be in BUYS all week long BABYYY

Nasdaq Long 7.17.25At 9 AM, price bounced off of the PD high which signified that price wanted to distribute above the current week high, old day high. I entered at 10 AM off the 9 AM candle. Awesome trade and execution.

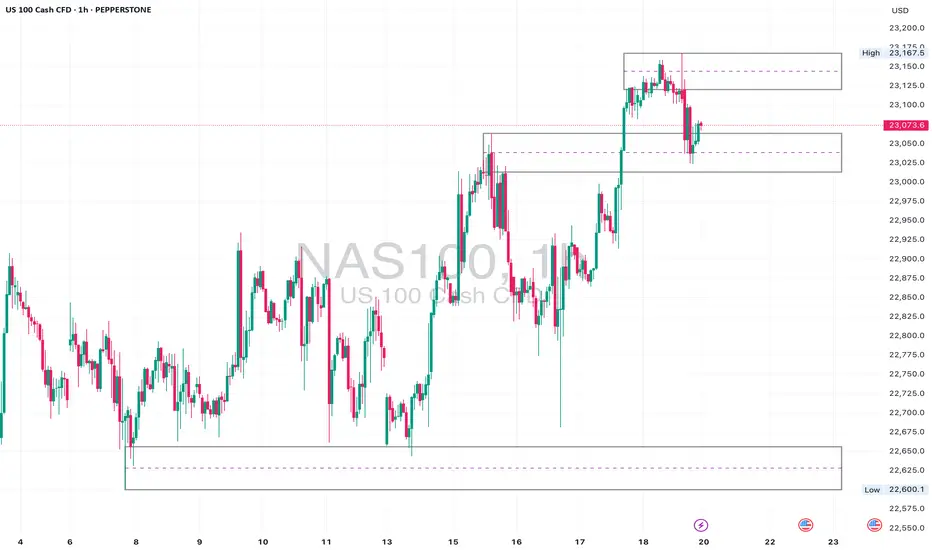
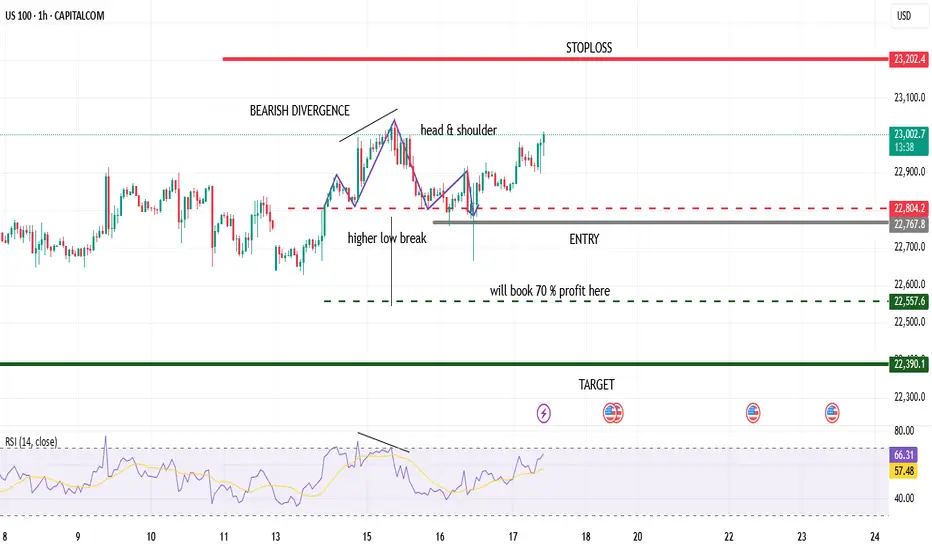
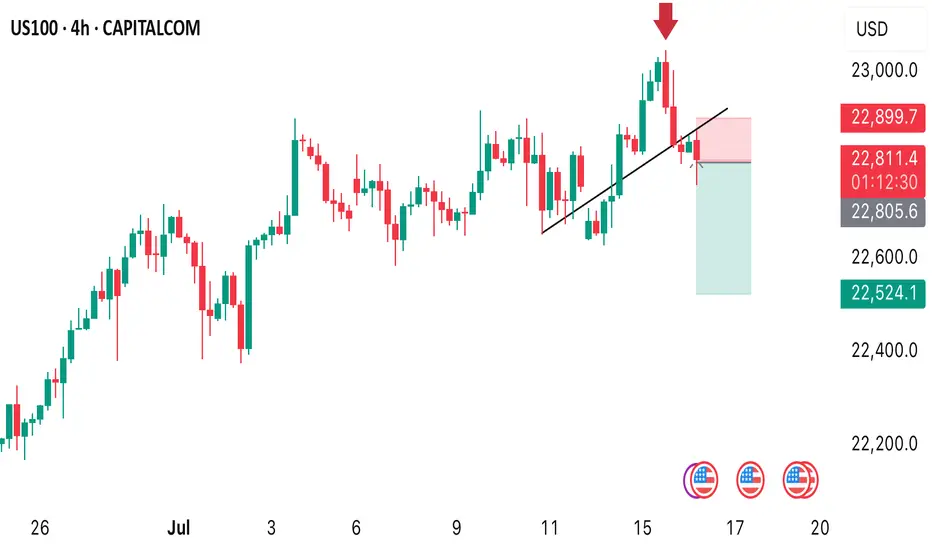
US 100 ShortUS 100 short
1st us100 formed bearish divergence
then break last higher low
also formed bearish head & shoulder
DXY index is bullish it also indicates for bearish stock
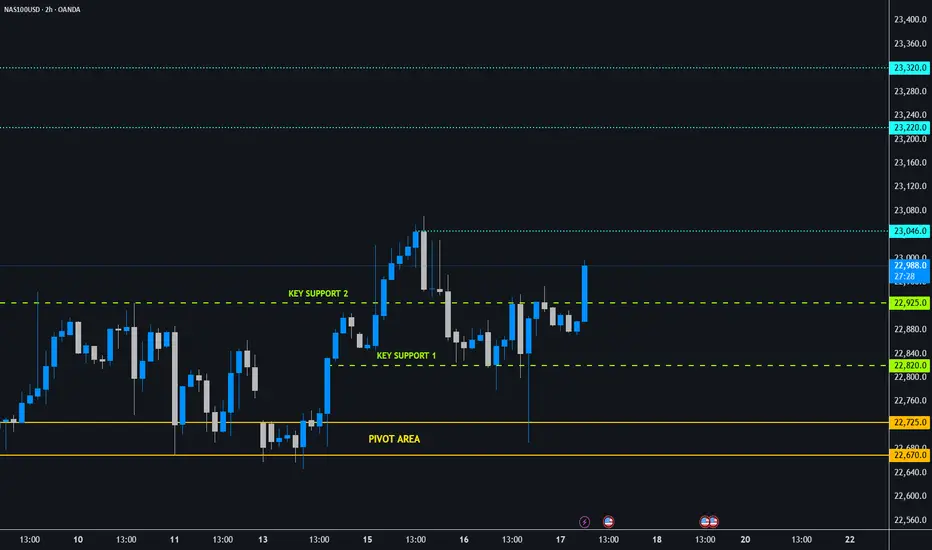
NAS100 - Follow Progress 3Dear Friends in Trading,
How I see it,
Remember:
"NASDAQ IS IN EXTREME GREED/OVERBOUGHT TERRITORY"
1) NASDAQ formed new key support/demand levels post CPI + PPI
2) Price needs to stabilize above 23046 next.
3) As long as both key support levels hold, the potential for more
bull runs remains high.
I sincerely hope my point of view offers a valued insight.
Thank you for taking the time to study my analysis.

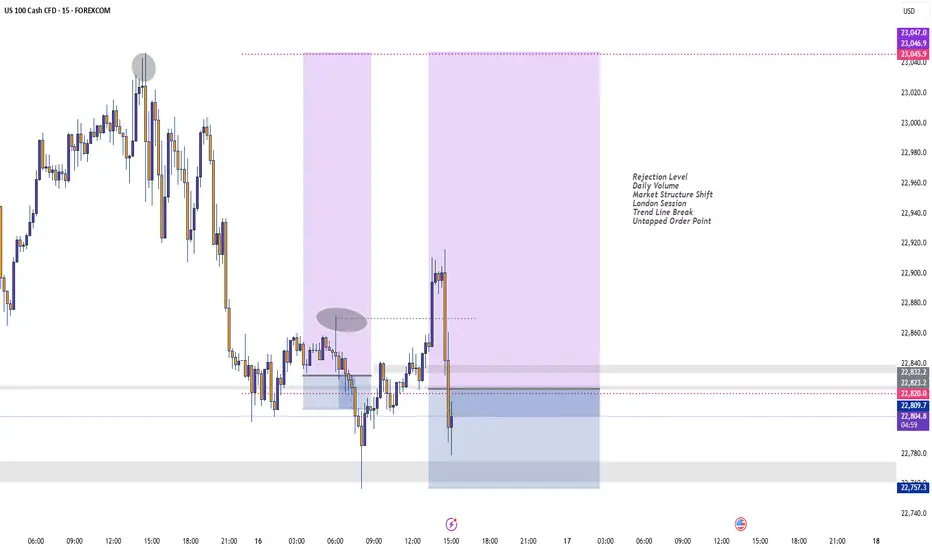
BuyRejection Level
Daily Volume
Market Structure Shift
London Session
Trend Line Break
Untapped Order Point
BuyRejection Level
Daily Volume
Market Structure Shift
US Session
Trend Line Break
Untapped Order Point

US100 SELL OPPORTUNITY A sell opportunity is envisaged as price dropped from the ALL TIME HIGH of 23000. I am shorting it with my target placed at 22524
Take advantage of this opportunity
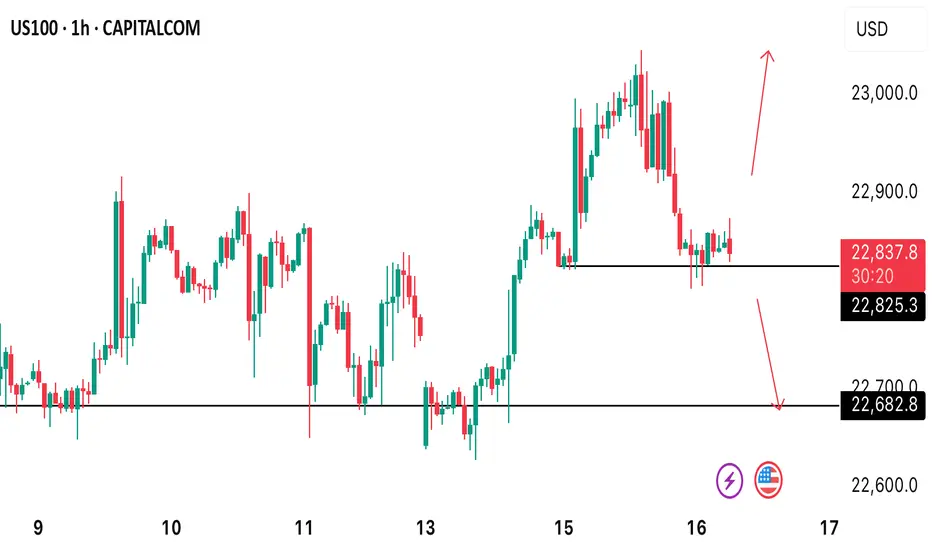
US100 H1 TECHNICAL ANALYSIS.US100 currently trades at 22830 what’s the next potential move on this asset? A reversal to 23024 high or a further decline to 22680. Let’s watch out and see how price reacts at that level.
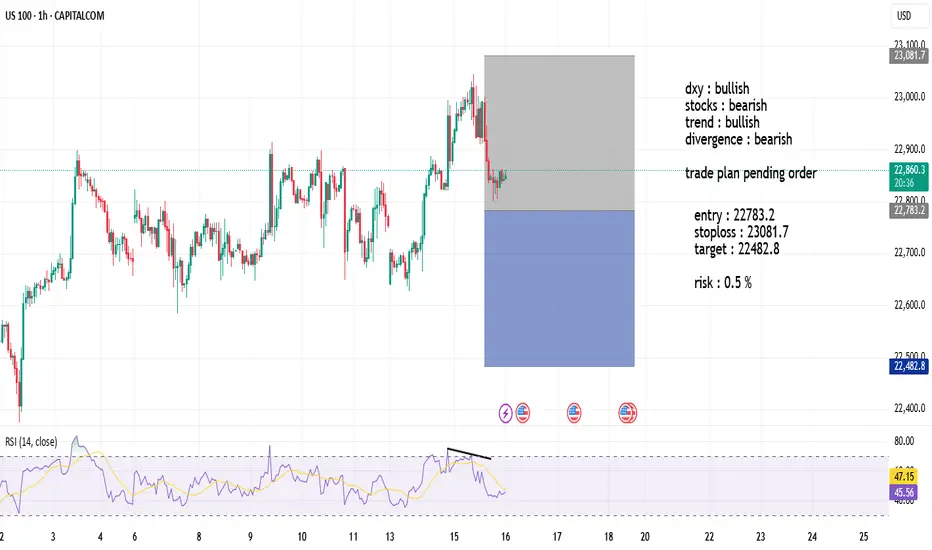
US100 SHORT dxy : bullish
stocks : bearish
trend : bullish
divergence : bearish
trade plan pending order
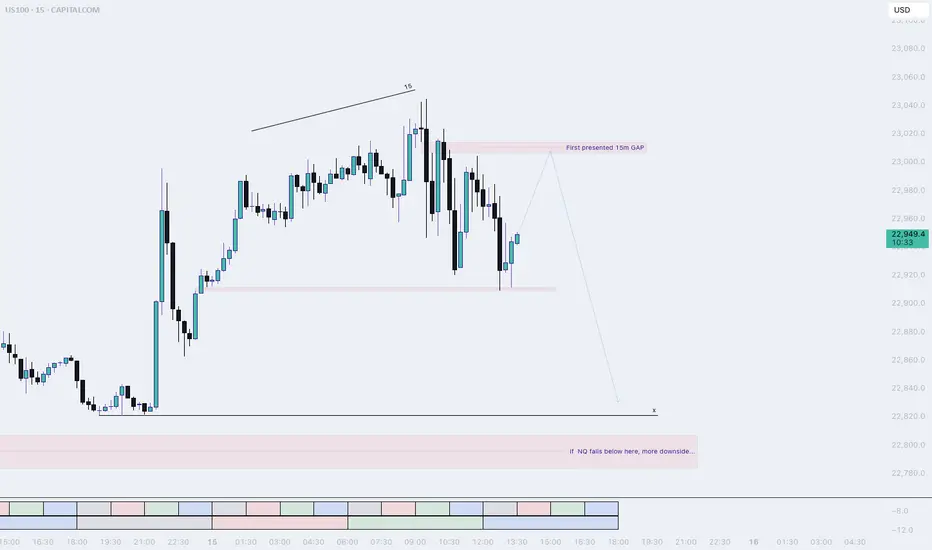
NQ, PM session (Tuesday) (long into short idea)Most likely price will make one more pullback before dropping into sell-side liquidity.
The laggish price action tells us that NQ is not really done IMO. I think a retracement into the 15m Gap is doable for NQ.
Keep watching NQ afterwards, We want to see a sudden drop to confirm our down movement.
Nasdaq Looking StrongHT in alignment.
Wouldn't be surprised to see this move higher.
Would like to wait for US open but big case for a long in my opinion at these levels.
Nice 2:1 example.
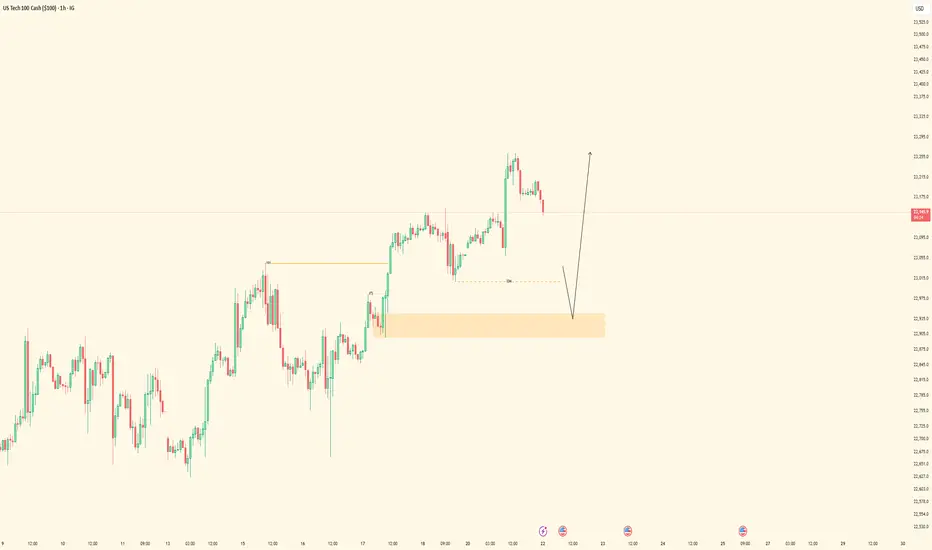
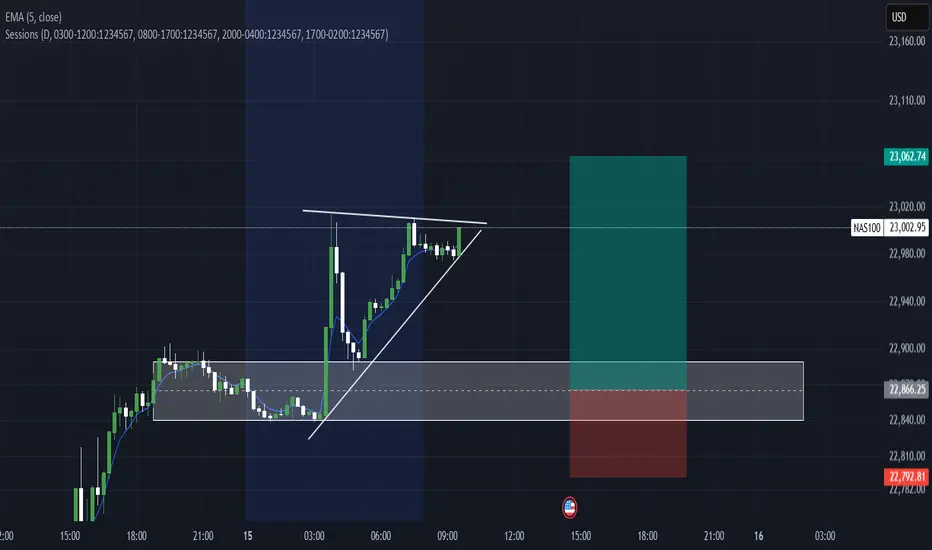
Nas100 Long We Currently Have an Ascending triangle (bullish continuation pattern) Forming After Asian Session & Price is consolidating just below the resistance level, forming higher lows.
We Have a Clearly defined demand zone below current price (gray box), Which also marks out our Bullish Order Block Formed Yesterday Which Price Should Come Retest Before Continuing Upwards.
Pro Tip for CPI Events
Expect increased volatility and fakeouts within the first few minutes.
Wait for a 5–15 min candle close for confirmation before entry.
Use lower timeframes (1m–5m) for entries, but keep higher timeframe structure in mind.
Remember To Like & Subscribe For More A+ Setups✅
NAS100 Forecast 24HAs of Tuesday, July 15, 2025, 2:03:11 AM UTC+4 the forecast for US100 (Nasdaq 100) in the next 24 hours presents a mixed outlook, with underlying bullish sentiment but caution due to ongoing market dynamics and potential for short-term pullbacks.
Factors Contributing to a Bullish Bias:
Underlying Strength and Breakout Behavior: Despite some short-term bearish technical signals, the Nasdaq is described as being in "breakout mode," decisively overriding key levels. This suggests underlying bullish momentum.
AI as a Growth Driver: Artificial intelligence (AI) remains a primary growth driver for the US economy and the technology sector, which heavily influences the Nasdaq 100. Confidence in secular tailwinds like cloud computing and semiconductor demand also persists .
Temporary US Dollar Weakness: The US Dollar Index (DXY) is currently in a retracement phase, pulling back after strength. A weaker dollar can provide a relief rally for risk assets like the Nasdaq, making US tech stocks more attractive to international investors.
Potential for Federal Reserve Rate Cuts: While no rate cuts are expected over the summer, a rate cut is considered likely in September. Historically, phases of moderate interest rate cuts in the absence of a recession have been positive for the US stock market.
"Buy on Dip" Mentality: Some analyses suggest that any short-term declines could be viewed as buying opportunities, indicating an underlying positive sentiment among investors.
Strong Earnings Expectations (for some tech): Despite general market concerns, some technology companies associated with AI innovation are expected to perform well, contributing positively to the index.
Factors Suggesting Caution and Potential for Bearish Movement/Volatility:
Escalating Trade Tensions (Trump's Tariffs): President Trump's continued aggressive protectionist stance and new tariff threats (e.g., against Canada) are a significant risk. These can create uncertainty, weigh on corporate profits, and lead to market volatility. This is frequently cited as the main risk for US indices.
Short-Term Technical Bearishness: Some technical analyses indicate a high chance of bearish candle closures across various timeframes (1H, 4H, Daily, Weekly, Monthly) , and some traders are eyeing selling opportunities from specific resistance zones (e.g., around 22,800-22,869).
Overvalued Growth Stocks: Following a recent rally, US stocks, particularly growth stocks, are trading at a premium to fair value. This can limit upside potential and make the market more susceptible to corrections if tariff negotiations falter or earnings guidance disappoints.
Market Seasonality: As we move into the latter half of July, market seasonality can shift from bullish to a more bearish stance.
Earnings Season and "Sell on the News" : While major financial institutions are kicking off Q2 earnings season, there's a potential for a "sell on the news" response, even if earnings aren't particularly bad, given the strong rally stocks have already staged.
Mixed Global Signals: European markets showing mixed performance and pressure from US futures suggest cautious global risk sentiment, which could cap upside for the Nasdaq.
Unfilled Stock Imbalances: Some technical analysis points to an unfilled stock imbalance around 22,300, which could act as a reaction point if the price pulls back.
Key Levels to Watch (Approximate):
Support: 22,600, 22,300 (unfilled imbalance), 21,611 (resistance-turned-support), 20,673 (Fibonacci extension and prior high).
Resistance: 22,800, 22,869, 23,000-23,100 (potential re-entry targets for rally continuation), 25,000-25,100 (approximate imbalance level to be filled).
In conclusion, for the next 24 hours, the US100 is likely to face a battle between underlying bullish momentum driven by AI and potential Fed policy, and the immediate headwinds of escalating trade tensions and some short-term technical bearishness. Traders should be prepared for volatility and quick shifts in sentiment based on news flow, particularly regarding trade and upcoming earnings reports.
For those interested in further developing their trading skills based on these types of analyses, consider exploring the mentoring program offered by Shunya Trade.
I welcome your feedback on this analysis, as it will inform and enhance my future work.
Regards,
Shunya Trade
⚠️ Disclaimer: This post is educational content and does not constitute investment advice, financial advice, or trading recommendations. The views expressed here are based on technical analysis and are shared solely for informational purposes. The stock market is subject to risks, including capital loss, and readers should exercise due diligence before investing. We do not take responsibility for decisions made based on this content. Consult a certified financial advisor for personalized guidance.

