Trump Delays Tariffs, but Trade Tensions with EU Are Heating UpDonald Trump is back in headline mode — and this time, the EU is in his crosshairs.
After weeks of relative calm, the US President reignited global trade tensions by announcing a 50% tariff on all EU imports. But in a surprise twist — and in true reality-TV fashion — he’s now pushed the start date
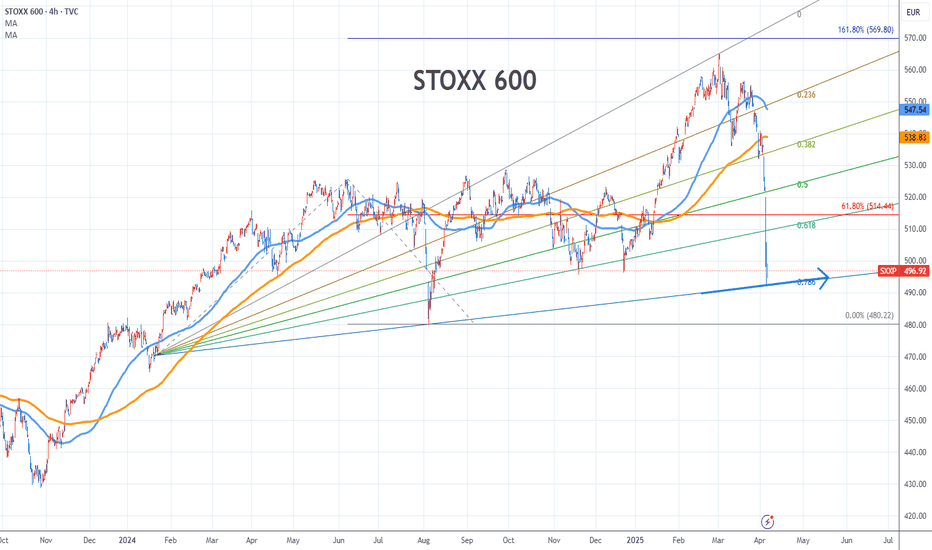
SXXP (STOXX 600) - Europe Intraday (April 127 2025)STOXX 600 - Intraday Setup
April 17 2025
Decision making - using 15minutes candles & candle pattern formation
Meaning "Long Trade" = Market expected to move up
Meaning "Short Trade" = Market expected to move down
Meaning "PDH" = Previous day High
Meaning "PDL" = Previous day Low
mins = minutes
Lon
Are Trump’s Tariffs More Bark Than Bite? What Markets Are SayingThe heated tariff drama is reverberating across global markets with a different impact depending on the region and the asset itself. Some markets, previously considered highly sensitive to extra tax charges, are actually doing better than the dominant stocks on Wall Street. Or maybe that’s just the
SXXP analysis Bull markets running on all markets with a new high looking to be set on the European index. We are however able to create a Fib Extension to the previous high set back in Jan 2022. The blue lines indicate a buy entry with each blue line signifying the next levels of TP in the case of a buy.
In th
Joe Gun2Head Trade - Month end buying to aid a correction? SXXPTrade Idea: Buying SXXP
Reasoning: Month end buying to aid a correction on SXXP
Entry Level: 387
Take Profit Level: 403
Stop Loss: 379
Risk/Reward: 2.03:1
Disclaimer – Signal Centre. Please be reminded – you alone are responsible for your trading – both gains and losses. There is a ve
See all ideas
Summarizing what the indicators are suggesting.
Oscillators
Neutral
SellBuy
Strong sellStrong buy
Strong sellSellNeutralBuyStrong buy
Oscillators
Neutral
SellBuy
Strong sellStrong buy
Strong sellSellNeutralBuyStrong buy
Summary
Neutral
SellBuy
Strong sellStrong buy
Strong sellSellNeutralBuyStrong buy
Summary
Neutral
SellBuy
Strong sellStrong buy
Strong sellSellNeutralBuyStrong buy
Summary
Neutral
SellBuy
Strong sellStrong buy
Strong sellSellNeutralBuyStrong buy
Moving Averages
Neutral
SellBuy
Strong sellStrong buy
Strong sellSellNeutralBuyStrong buy
Moving Averages
Neutral
SellBuy
Strong sellStrong buy
Strong sellSellNeutralBuyStrong buy
Displays a symbol's price movements over previous years to identify recurring trends.
Frequently Asked Questions
The current value of STOXX 600 is 535.80 EUR — it has fallen by −1.89% in the past 24 hours. Track the index more closely on the STOXX 600 chart.
STOXX 600 reached its highest quote on Mar 3, 2025 — 565.18 EUR. See more data on the STOXX 600 chart.
The lowest ever quote of STOXX 600 is 155.38 EUR. It was reached on Mar 9, 2009. See more data on the STOXX 600 chart.
STOXX 600 value has decreased by −2.70% in the past week, since last month it has shown a −1.05% decrease, and over the year it's increased by 3.49%. Keep track of all changes on the STOXX 600 chart.
The top companies of STOXX 600 are XETR:SAP, EURONEXT:ASML, and EURONEXT:MC — they can boast market cap of 325.97 B EUR, 263.33 B EUR, and 263.27 B EUR accordingly.
The highest-priced instruments on STOXX 600 are LSE:GAW, GPW:LPP, and OMXCOP:MAERSK_B — they'll cost you 16,330.00 EUR, 16,185.00 EUR, and 12,720.00 EUR accordingly.
The champion of STOXX 600 is XETR:ENR — it's gained 266.33% over the year.
The weakest component of STOXX 600 is OMXCOP:NOVO_B — it's lost −66.29% over the year.
STOXX 600 is just a number that lets you track performance of the instruments comprising the index, so you can't invest in it directly. But you can buy STOXX 600 futures or funds or invest in its components.
The STOXX 600 is comprised of 594 instruments including XETR:SAP, EURONEXT:ASML, EURONEXT:MC and others. See the full list of STOXX 600 components to find more opportunities.


