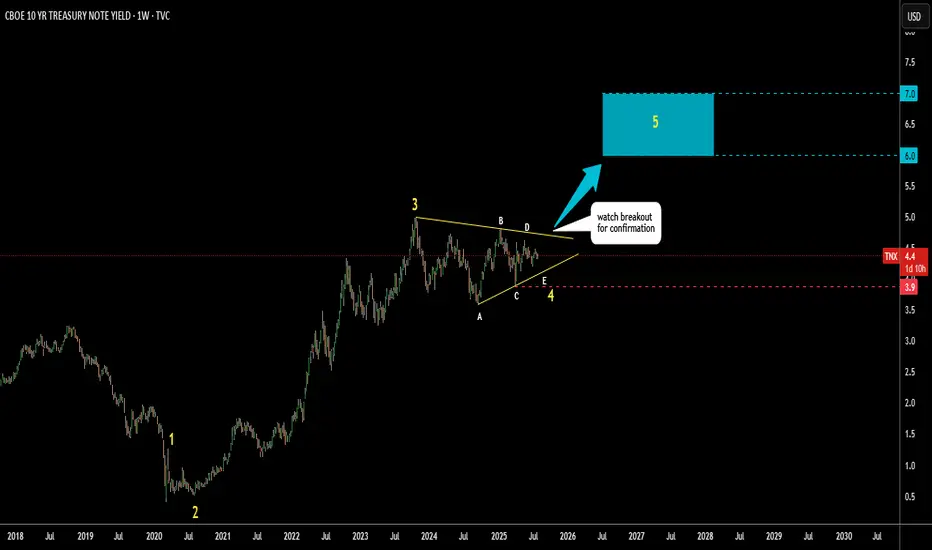
US 10Y yield: Triangular Consolidation, next 6-7%I’ve spotted a well-known triangular pattern forming on the US 10-year Treasury yield.
This appears to be the development of a large Wave 4.
Wave E of Wave 4 may still be unfolding.
Watch to see if it holds above the Wave C low at 3.9%.
A breakout above resistance near 4.7% would confirm the pattern.
The target zone is set between the 38.2% and 61.8% retracement levels of Waves 1 to 3,
highlighted with a blue box between 6% and 7%.
Could tariffs cause a major spike in yields—or will something else trigger it?
Share your thoughts in the comments below.
TNX trade ideas
10-Year Treasury Yield Nudges HigherThe 10-Year Treasury yield has been rangebound for about 1-1/2 years, but some traders may see upside risk.
The first pattern on today’s chart is the series of lower highs since October 2023. TNX violated the trendline in December and may be holding above it now. That could suggest a period of downward movement has ended.
Second is the December low of 4.13. Yields tested and held that level in early March. They made a higher low in subsequent weeks -- even after the Federal Reserve reduced quantitative tightening (QT). MACD is also rising.
Third, TNX ended yesterday at its highest level in more than a month. It’s also challenging a gap from February 25 caused by weak consumer confidence.
Finally, Wednesday’s close was above the peak from June 2008, when the global financial crisis was taking hold. Staying here may confirm a long period of generationally low borrowing costs has come to an end.
TradeStation has, for decades, advanced the trading industry, providing access to stocks, options and futures. If you're born to trade, we could be for you. See our Overview for more.
Past performance, whether actual or indicated by historical tests of strategies, is no guarantee of future performance or success. There is a possibility that you may sustain a loss equal to or greater than your entire investment regardless of which asset class you trade (equities, options or futures); therefore, you should not invest or risk money that you cannot afford to lose. Online trading is not suitable for all investors. View the document titled Characteristics and Risks of Standardized Options at www.TradeStation.com . Before trading any asset class, customers must read the relevant risk disclosure statements on www.TradeStation.com . System access and trade placement and execution may be delayed or fail due to market volatility and volume, quote delays, system and software errors, Internet traffic, outages and other factors.
Securities and futures trading is offered to self-directed customers by TradeStation Securities, Inc., a broker-dealer registered with the Securities and Exchange Commission and a futures commission merchant licensed with the Commodity Futures Trading Commission). TradeStation Securities is a member of the Financial Industry Regulatory Authority, the National Futures Association, and a number of exchanges.
TradeStation Securities, Inc. and TradeStation Technologies, Inc. are each wholly owned subsidiaries of TradeStation Group, Inc., both operating, and providing products and services, under the TradeStation brand and trademark. When applying for, or purchasing, accounts, subscriptions, products and services, it is important that you know which company you will be dealing with. Visit www.TradeStation.com for further important information explaining what this means.

Stay Neutral on 10-Year Treasury as Market Uncertainty Looms
- Key Insights: The 10-Year Treasury yield is at a critical juncture amid
ongoing market uncertainty. With central banks selling US Treasuries, yields
are volatile. Analysts recommend maintaining a neutral stance, suggesting
that holding onto bonds and cash is prudent in the face of unpredictable
market corrections and potential equity retracement.
- Price Targets: Next week targets for 10-Year Treasury yield are set cautiously
due to market conditions. T1 is projected at 4.30, and T2 at 4.35,
reflecting resistance levels. Stop levels are placed conservatively at S1 at
4.20 and S2 at 4.15, expecting potential pullbacks.
- Recent Performance: The 10-Year has experienced price fluctuations due to
central banks selling off treasuries, impacting yields. Despite initial
increases, resistance has been detected, aligning with historical
retracement levels, and signaling a potential shift towards lower yields.
- Expert Analysis: Analysts from Morgan Stanley, Citi, and Goldman Sachs
emphasize a neutral approach, urging investors to focus on cash and bonds.
This advice stems from concerns over inflated equity valuations and the
ramifications of rising interest rates that might dampen stock market
performance.
- News Impact: Recent talks of reciprocal tariffs by the US administration could
lead to shifts in trade patterns, affecting the US dollar and treasury
yields. The Federal Reserve's plan to adjust security redemption caps
underscores liquidity concerns. Against this backdrop, investing in bonds,
gold, and cash is recommended, resonating with the market's cautious
sentiment.

AriasWave Market Update - You Might Want To Watch This... Part 1In this video, I'm finally breaking my silence. I can’t hold back my bearish outlook any longer, so I’m launching a series of videos to break down exactly why I see trouble ahead and what it could mean.
While I won’t cover everything in this first video, I’m kicking off the conversation now that the floodgates are open—thanks, in part, to the circus in Washington, D.C. (or so you think). From crypto and stocks to bond yields and beyond, I’ll cover it all.
Stay tuned so you’re not left chasing false hope in a dead-cat bounce.

TNX Explosion IncomingI think I've made my point with my thesis on interest rates, but I will continue to beat this drum until something breaks. Something is going to break soon. The market is fighting the fed ever since they started cutting and the market is calling out Powell's rate cut nonsense. They cut by 100bps, but yields went up 100bps. This is very concerning and we've seen this before, this is going to kill equities when the time comes. Yields are screaming danger right in our faces.
I've seen many bears talk about 5% and I think that is laughable. How about 8%-12% or even higher? I could go on about why I think that fundamentally, but I've already done that. Focusing on the technicals, we see that TNX had a massive breakout in 2020. The downtrend had been forming since the high in 1987, history is repeating itself as it always does. In addition to the nearly 40 year trend breakout, we also have a shorter term bull flag starting from the high in October that just broke. Heading right up into 5% and I believe it will keep on going. Flag pole target is around 8.8%, final target is the 1987 high around 10%. That's the final target for now anyway, I fear it will go much higher.
I've been trying to warn folks about this all year and there's a reason for that, it's not because I hate America, it's because I love America. I'm obviously not a financial advisor, this is for education. However, it's probably not very helpful to just say the market is gonna crash with no plans or ideas to position based on that belief. Shorting is the go to, but very dangerous and somewhat greedy. I think it's at least time to close all positions using margin if you have any, trim winners and take some profit, get exposure to rising yields, get volatility exposure, get some gold, and keep larger cash reserves and savings. Avoid MSTR at all costs.

TNX - ten year note yield still in an uptrendIs it just me or is it weird that even the yield of treasury notes trades within channels and diagonals like stocks and oil ?
This chart pattern could be described as a bull flag.
Rising yields don't necessarily lead to lower stock prices:
But the bigger picture issue could be the interest payments of the US government, which reached a record of 4.4 trillion USD in 2024.

Ten year double bottom breakout?Not what we want to see, hope it fails. It wouldn't be good for equities.

Bonds Bull Has Arrived in The China ShopConfluence of many significant long term indications showing it's about to start raining bond profits like it's 1981
On the chart:
-4 month Heiken Ashi candles
-6 period low RSI
-25 period RSI MA
-RSI-RSI MA
-RSI-RSI MA MA
-25 period DyDX of RSI_RSI MA MA

TNX BreakoutTNX failed on the first breakout attempt but quickly reclaimed and is now looking poised for another leg up. Many are calling for a move back up to 5% and I personally think that is likely to happen as well. We may get a reaction tomorrow morning after PPI and jobs data and I expect it to be up for now.
I refuse to believe stocks will be able to go up in unison for yields much longer. We are nearing beginning of the end now, it is inevitable. Question is when and how bad. We'll find out.

10-year yield caught in a bullish pattern. The idea that yields could surpass the 2023 highs is unfathomable to some. However, technicals suggest yield on the 10-year treasury could rise above 5% if the pattern is confirmed.

10yr TreasuryGoing into NFP, before a POTUS election and FOMC guidance next week, the 10yr has been quite a moving train these last few weeks.
There are too many gaps to be filled to call any lower pricing target. With the November contract taking over volume yesterday we may see some calming down while the fundamentals reveal themselves these next few business days.
I'm sure most new home buyers or potential buyers would appreciate some retracement on this run since it will reduce the 30yr mortgage rate. For some USDA purchasers the 5yr may also hold some relevancy.
Also, as a side note the 10yr has either dipped (.2% to .5%) or went sideways when reading the last 5yrs of price action (Oct31st-Nov25th zone).

Yields Revisit a Key LevelThe recent rise in Treasury yields has caused some worry among stock investors. However there could be reason to think the move is ending.
Today’s chart of the 10-year Treasury note yield uses two-week candles to provide a longer-term view. It highlights the 4.324 percent level, which was a peak back in June 2008 that became important again in October 2022. TNX paused at the same spot in August 2023 before surging toward 5 percent.
There was further churning at 4.324 percent between February and June. Also notice how yields accelerated lower in July after breaking the level. All those points may confirm its importance -- and make traders more attentive to it being tested this week. Will a reversal here confirm lower yields are coming?
Next, March 2024 saw a lower high than October 2023. If yields decline from here that would represent another lower high.
Finally, you have the March 2023 low of 3.25 percent. At that time, the Federal Reserve was still raising interest rates. Now, with an easing cycle underway, some investors may see a possibility of yields filling at least some of that space.
TradeStation has, for decades, advanced the trading industry, providing access to stocks, options and futures. If you're born to trade, we could be for you. See our Overview for more.
Past performance, whether actual or indicated by historical tests of strategies, is no guarantee of future performance or success. There is a possibility that you may sustain a loss equal to or greater than your entire investment regardless of which asset class you trade (equities, options or futures); therefore, you should not invest or risk money that you cannot afford to lose. Online trading is not suitable for all investors. View the document titled Characteristics and Risks of Standardized Options at www.TradeStation.com . Before trading any asset class, customers must read the relevant risk disclosure statements on www.TradeStation.com . System access and trade placement and execution may be delayed or fail due to market volatility and volume, quote delays, system and software errors, Internet traffic, outages and other factors.
Securities and futures trading is offered to self-directed customers by TradeStation Securities, Inc., a broker-dealer registered with the Securities and Exchange Commission and a futures commission merchant licensed with the Commodity Futures Trading Commission). TradeStation Securities is a member of the Financial Industry Regulatory Authority, the National Futures Association, and a number of exchanges.
TradeStation Securities, Inc. and TradeStation Technologies, Inc. are each wholly owned subsidiaries of TradeStation Group, Inc., both operating, and providing products and services, under the TradeStation brand and trademark. When applying for, or purchasing, accounts, subscriptions, products and services, it is important that you know which company you will be dealing with. Visit www.TradeStation.com for further important information explaining what this means.

20% Interest Rates Could Crash The Market 98%It’s been a while since I last posted, but I’ve got a good reason to start again.
If you take a close look at the charts in this video, you'll notice the potential for a significant market decline across the board.
By analyzing the Dow Jones and interest rates together, it becomes evident that we are nearing this point.
I'm not influenced by news or personal biases—I just prefer not to invest when the market is in this state.
Whether it’s stocks, precious metals, or crypto, I believe it’s wise to be cautious when these signals appear.
The long-term interest rate chart gives me strong reasons to believe we could see a historic drop in asset prices.
Basic concepts like mean reversion and resistance turning into support are some of the key factors that back my AriasWave analysis.
Stay tuned for more updates now that I’m back to sharing new ideas.

Apparent Downtrend in 10-Year Treasury YieldsTreasury yields have been sliding since April. Now, after a two-month pause, some traders may see further downside.
The first pattern on today’s chart is the series of lower highs since mid-July. TNX could be stalling at the same resistance, potentially confirming the downtrend.
Second is the December low around 3.785. Yields tried to hold that level in August but remained mostly below it in September. Is the level breaking?
Third, stochastics have reached an overbought condition. (Notice the white arrows on the lower study.)
Next, TNX is still about 50 basis points above last year’s low. That may cause some chart watchers to see space for a move lower.
TradeStation has, for decades, advanced the trading industry, providing access to stocks, options and futures. If you're born to trade, we could be for you. See our Overview for more.
Past performance, whether actual or indicated by historical tests of strategies, is no guarantee of future performance or success. There is a possibility that you may sustain a loss equal to or greater than your entire investment regardless of which asset class you trade (equities, options or futures); therefore, you should not invest or risk money that you cannot afford to lose. Online trading is not suitable for all investors. View the document titled Characteristics and Risks of Standardized Options at www.TradeStation.com . Before trading any asset class, customers must read the relevant risk disclosure statements on www.TradeStation.com . System access and trade placement and execution may be delayed or fail due to market volatility and volume, quote delays, system and software errors, Internet traffic, outages and other factors.
Securities and futures trading is offered to self-directed customers by TradeStation Securities, Inc., a broker-dealer registered with the Securities and Exchange Commission and a futures commission merchant licensed with the Commodity Futures Trading Commission). TradeStation Securities is a member of the Financial Industry Regulatory Authority, the National Futures Association, and a number of exchanges.
TradeStation Securities, Inc. and TradeStation Technologies, Inc. are each wholly owned subsidiaries of TradeStation Group, Inc., both operating, and providing products and services, under the TradeStation brand and trademark. When applying for, or purchasing, accounts, subscriptions, products and services, it is important that you know which company you will be dealing with. Visit www.TradeStation.com for further important information explaining what this means.

Risk Off with R2 Strategy IILet's see what comes up with
SPX --> 5.744 points
TNX --> 3.790%
So since the Risk Off was reported, the switching of the R2 strategy recorded a +6.237% for the treasury and a -4.00% for the SPX in the first "round" from 1 to 13 August, and a new Risk Off which it started on August 21st and a +2.857% for the treasury is still underway compared to a decline of 3.75% on the SPX.

TNX goes up from this levelMODs have suggested that I provide more detail about the picks I make.
Sorry. I'm not as verbose as y'all, and I don't like things to be complicated.
My trading system is very simple.
I buy or sell at top & bottom of parallel channels.
I confirm when price hits Fibonacci levels.
Bonus if a TTM Squeeze in in play.
I hold until target is reached or end of year, when I can book a loss.
So...
Here's why I'm picking this symbol to do the thing.
Price at bottom channel
Stochastic Momentum Index (SMI) at oversold level
TTM Squeeze just turned off
Impulse MACD is crossing over to the upside
Price very near Fibonacci level
In at $3.679
Target $3.9, top of channel
will add to position at $3.6, $3.5

10 year interest rate w/ 30 year average mortgage ratesThis is just a simple chart with the two overlaid together to see the relationship between the two as well as having vertical lines indicating when the federal reserve effectively increased or decreased the fed funds rate

Risk Off with R2 StrategySo since the Risk Off was reported, the switching of the R2 strategy recorded a +6.237% for the treasury and a -4.00% for the SPX in the first "round" from 1 to 13 August, and a new Risk Off which it started on August 21st and a +2.857% for the treasury is still underway compared to a decline of 3.75% on the SPX.

Head & Shoulders pattern: 10 year yield could drop to 2.87%The series of tops shaped notorious Head & Shoulders pattern
on 10-Year Treasury yield (TNX).
The tallest peak is the Head and Shoulders are on both sides.
The Neckline is the support that is built through valleys of the Head.
The price has breached the Neckline this summer triggering the pattern bullish scenario.
The target is calculated by subtracting the height of the Head (from top to Neckline) from
breakdown point on the Neckline. It is located around 2.87%.
Almost 1% down from the current level

Treasury Yields: The Downtrend SteepensThe 10-year Treasury yield has been a key chart for risk appetite since interest rates started rising in late 2021. Now it might be confirming a move in the opposite direction.
The first pattern on today’s chart of TNX (using 2-day candles) is the series of lower highs since October. Notice the steepening downward slopes of the falling trendlines. Does this reflect a growing belief that interest rates are headed lower?
Second, the yield broke June’s low 4.188. It’s also under the key 4.32 level dating back to June 2008. That may suggest the 2-3 year uptrend is fading.
Traders may next eye the December low around 3.80 as a key level to watch.
The move comes after the Federal Reserve suggested a rate cut is more likely next month. News and data could also support the change. For example, initial jobless claims were above forecasts and continuing claims reached their highest total in almost three years. Unit labor costs were below estimates and productivity surprised to the upside. Data from the Institute for Supply Management also indicated a potentially sharp slowdown in manufacturing last month.
TradeStation has, for decades, advanced the trading industry, providing access to stocks, options and futures. See our Overview for more.
Past performance, whether actual or indicated by historical tests of strategies, is no guarantee of future performance or success. There is a possibility that you may sustain a loss equal to or greater than your entire investment regardless of which asset class you trade (equities, options or futures); therefore, you should not invest or risk money that you cannot afford to lose. Online trading is not suitable for all investors. View the document titled Characteristics and Risks of Standardized Options at www.TradeStation.com . Before trading any asset class, customers must read the relevant risk disclosure statements on www.TradeStation.com . System access and trade placement and execution may be delayed or fail due to market volatility and volume, quote delays, system and software errors, Internet traffic, outages and other factors.
Securities and futures trading is offered to self-directed customers by TradeStation Securities, Inc., a broker-dealer registered with the Securities and Exchange Commission and a futures commission merchant licensed with the Commodity Futures Trading Commission). TradeStation Securities is a member of the Financial Industry Regulatory Authority, the National Futures Association, and a number of exchanges.
TradeStation Securities, Inc. and TradeStation Technologies, Inc. are each wholly owned subsidiaries of TradeStation Group, Inc., both operating, and providing products and services, under the TradeStation brand and trademark. When applying for, or purchasing, accounts, subscriptions, products and services, it is important that you know which company you will be dealing with. Visit www.TradeStation.com for further important information explaining what this means.

US 10-Year Yields: The Domino Effect on Global MarketsHey traders! 🌟 Let's dive into the fascinating world of the US 10-year Treasury yields and their ripple effects across the financial markets. Buckle up! 🚀
The Bond-Yield Symphony 🎻
US 10-year yields are like the heartbeat of the financial markets. 💓 When they move, everything else follows. Here's a quick rundown on how these mighty yields impact commodities, stocks, and the United States dollar:
Commodities 🛢️💰: Higher yields often lead to a stronger dollar, making commodities priced in USD more expensive for foreign buyers. This usually puts downward pressure on commodity prices.
Stocks 📈💼: Rising yields can spell trouble for stocks, especially high-growth tech stocks. Why? Higher yields mean higher borrowing costs and potentially lower profits. Investors might shift from equities to bonds, seeking safer returns.
United States Dollar 💵📊: When US yields climb, the dollar tends to strengthen. Investors flock to the higher returns offered by US assets, boosting demand for the greenback.
What Rising Yields Mean 📈🔥
We’ve got some interesting levels on our radar. Demand is spotted between 4.032% and 4.233%, while supply looms large at 5.115% to 5.306%. With expectations pointing towards more rising yields, let's break down what this could mean:
Commodities 🛢️💔: Brace for potential downside. As yields rise, the stronger dollar could weigh heavily on commodities like gold, oil, and silver. Watch for key support levels to gauge buying opportunities.
Stocks 📉🚨: High-flying growth stocks might feel the pinch as investors rotate into safer, yield-bearing assets. Look out for increased volatility in the stock markets, especially in tech-heavy indices like the NASDAQ.
United States Dollar 💵🚀: The USD could see a significant boost, attracting global capital. A strong dollar might also impact US exports, making them more expensive on the international market.
The Fun Part: Chart Watching! 📊🔍
We’re keeping a close eye on those critical levels. If yields push through the 5.115% to 5.306% supply zone, we could be in for a wild ride. 📉 Conversely, if yields find support within the 4.032% to 4.233% demand zone and we see a bullish reversal on the daily chart, a rally up to the supply zone could be on the cards. 📈
In essence, buying at demand and selling at supply remains a classic strategy. Should bond yields enter the demand zone and reverse back bullishly, we might witness a significant run up to the supply levels. 🚀
Keep those charts handy, and let’s ride these waves together! 🌊📈
Happy trading, and may the pips be ever in your favor! 🤑✨
#Trading #Finance #Investing #US10YearYields #Commodities #Stocks #USD #MarketTrends #TechnicalAnalysis #Bonds #Yields #InvestSmart

TNX BreakoutTNX had weakened quite a bit after topping out in April and falling below its ascending wedge. However, after some consolidation, we now have a bull flag breakout that could lead to a much larger move, looking pretty scary for bulls if you ask me. It'll be interesting to see if TNX reacts to what Powell says in the morning. This will be an important watch either way.

Market Crash - TNX RocketThis is one of the major parts of my short thesis. We're seeing it play out in real time now. I expect treasury yields to continue to spike due to persistent inflation and the fed's current target rate. We're also seeing a lot of strength in DXY. If TNX continues higher, BOJ will have to sell more treasuries to support the Yen, which will cause yields to spike and tech stocks to dump.
