40 Years of TNX and SPX and Their Inverse CorrelationFor the last 40 years, I (we) have invested in a never-ending Bull Market in stocks.
During this time:
Stay the Course and Buy the Dips worked.
But as Ray Dalio said recently: THE PERIOD OF EASY MONEY IS OVER!
The new paradigm will either be Zero or Rising Rates, neither of which will be kind to long term investors.
The BIG MONEY has already begun to or completed exiting stocks. That started around January 1st.
Be very careful what you do now!
TNX trade ideas

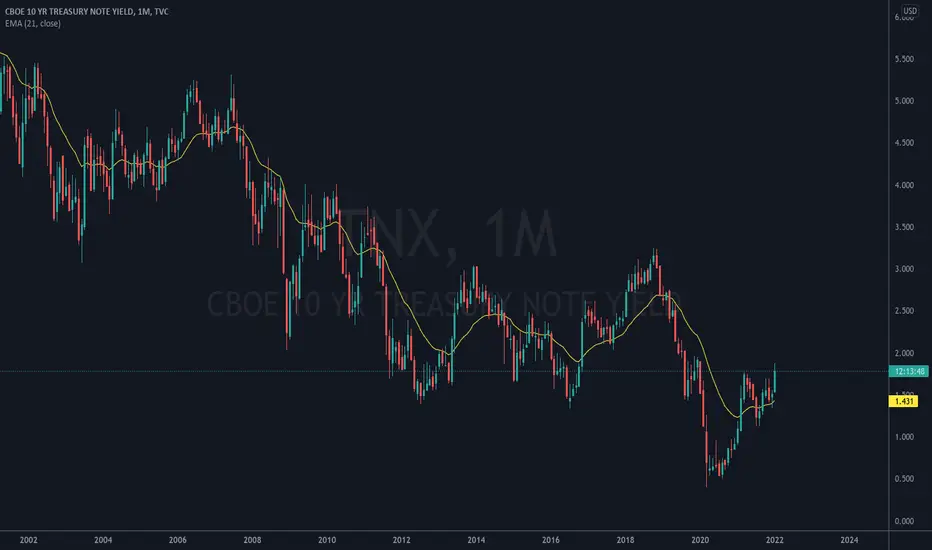
40 YEARS OF EASY MONEY HAS ENDEDThis chart of the TNX shows it all. Now zero interest for awhile or rebounding rates and their consequences.

Inversion of the yield curve 10 year minus 2 year yieldsThe yield curve between the 10 and 2 year has been collapsing since March 2021. It is erie to behold that the inversions of the yield curve were occurring 1-2 years before past recessions occurred in 2000 and 2008 and even before the recent pandemic. One can see when complete inversion occurs when the basis point difference goes BELOW ZERO. It would seem quite possible we are seeing the beginning of another recession as the yield curve flattens. One can also see periods of steepening and reflation when the opposite trend occurs. This is a useful tool for equity investors to see when the water is safe for investing. Right now, it appears caution is advised and a recession may be imminent.

$spy $tnx What's NextThings get very interesting from here. Stocks did not follow bond prices lower as bonds made new low. Which do you buy here? Stocks or bond? or.....Do you sell stocks and buy bonds? or just sell stocks? Wonder what @allstarcharts thinks?

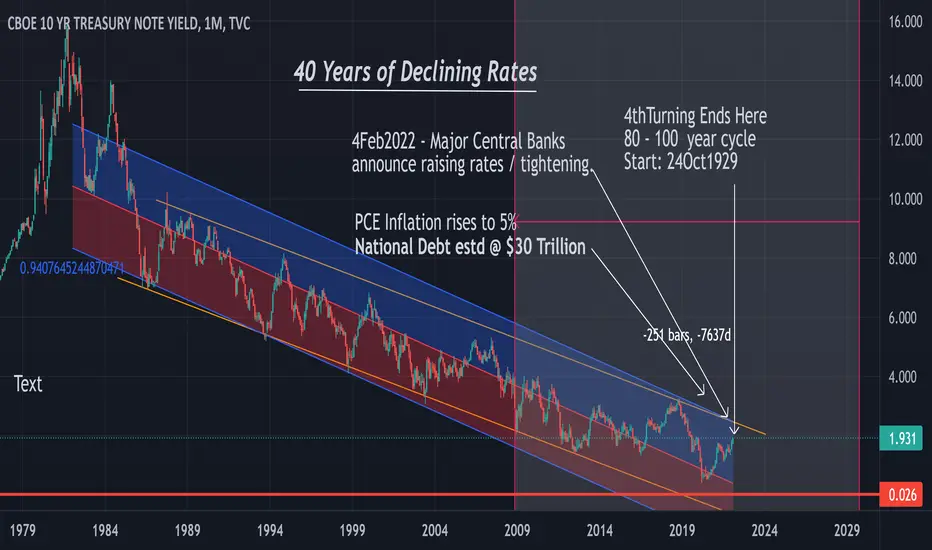
40 Years of Declining RatesMy complete chart as of this am when the major central banks announced tightening.

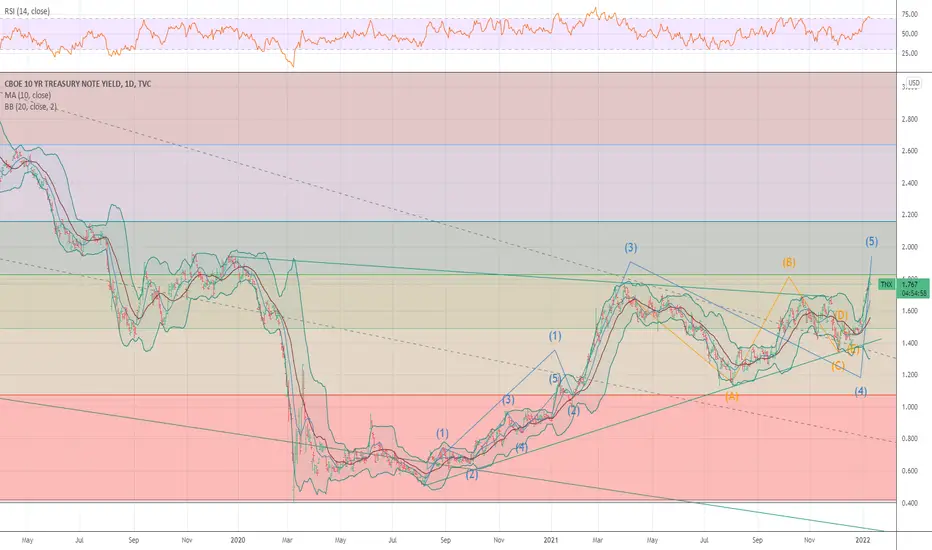
10Y Treasuries continue their way to 5%When ABCD-ab-12 are already competed, and wave 3 of c is already underway, the market is left with very little time to think what to do next.
As I said earlier - the move in treasuries is unstoppable and will cause a major market crash, bringing SPX to ~1500, EURUSD to below 0.87.

THE 40 YEAR BEAR MARKET IN 10 YEAR TREASURY NOTE INTEREST RATEThe attached chart shows 40 years of declining 10 year rates. As we all know, that rate is the basis for mortgage rates and just about everything else. During that half cycle the housing market boomed, the stock market boomed and generally speaking, corporations and individuals prospered.
But that trend has ended.
Thursday I would have said that rates would either remain low for an indefinite period while inflation soared or rates would be raised to quell inflation. But Friday Central Banks around the world announced tightening.
The party is over!
It is time to batten down the hatches, lock in long term profits on stocks, rentals and any other investments that correlate inversely with interest rates.
Obviously the major players saw this coming and started bailing at the first of2022.
Now us little fish must do what we can to avoid losing the wealth we have.
As an aside, it was announced last year that Bill Gates was diversifying into farm land. Obviously that anticipates food shortages and inflation.............
I will post more on this once the picture becomes clearer.
midnitepoet
Traders' guide: 10 yr Yield + markets positively linkedFirst - if you think markets always move opposite to yields, please be open to learning something new. Covariance, in statistics, is the relationship between two random variables. This chart indicates periods of negative (blue) and positive (yellow) covariance between the 10 year yield and SPY. If you think about it, this makes sense because there are times when rising rates give investors more confidence in the economy. Traders can benefit from knowing the general relationship.
> Yields change in response to central bank activity - I cannot explain why the covariance flips
> Other factors influence markets but yield is reliable for intraday moves
> 1.77 has been key support for the yield recently, and hence for markets
> Above 1.83, markets get spooked and covariance becomes negative (you can see this in yellow boxes also)
> Below 1.74,1.73 should increase selling momentum
How am I using this information to plan trades?
> I believe yields will drop further and take markets lower, so I am looking for swing put trades
> This strong upward rally has brought indices and stocks to moving average and price resistance areas, which technically also indicate swing puts
> I have successfully day traded DIA and QQQ calls and puts using yield changes a guide
> I was too early in buying swing puts on 31 Jan, but since they expire 18Feb I can hold the loss for now
> As I finish writing this, yield moved up from 1.748 to 1.771 and markets have also been moving up - I see this as a good time to buy swing puts

TNX - Back to the Box10 Yr Yields are catching the FED YCC shove at present, it's feeble but there.
Powell's Backtrack yesterday was frankly pathetic.
"Rates will remain near Zero for the near term"
blah blah blah... idiocy.
___________________________________________________________________
The Stock Market is the Economy is what this fraud meant to say, but could not.
One day, he will.
Until then, the DX and TNX are going to continue to Range and Consolidate.
There's another accident ahead, regardless of the protestations of the Bond Gurus,
007s and Bandits.
They never seem to catch the Drift, always buying and claiming the New Bond Bull
is beginning.
After 4.5 decades it's over fanbois.
If you can't sort it out... it's your Capital being eaten alive by Inflation.

Bond market leading fed once again as predictor of stock market?If any of the key treasury/bond yields reach the downtrend resistance trendline, we should see the start of bear makret/crash in stock market within months but this cycle seems very close to the top already.

The TNX is breaching major resistanceThe next target technical levels are between 2.5 and 3 % on the 10 year. If this plays out its lights out for the speculative parts of the markets.
TNX - 10Yr Yields Sell Offers and Bond VX / Trouble
Bond Bagholders just never learn - this Secular Cult is doomed to extinction.
The two-year Treasury yield posted its biggest single-day jump since the
market volatility of March 2020.
Of course, this was after Federal Reserve Chair Jerome Powell promoted
the Policy Flip Flop that the Fed will raise rates in March, and left the screen
porch door open for a quicker than-anticipated pace of rate increases.
The Dot Plot is wiggling in excitement.
IN reality, the FED will begin to Temper expectations.
It is what they do - Lie Cheat Steal / Delay.
10 Yr Yields have seen another fantastic ROC-driven Spike which advanced
well ahead of the Pre-Spring Meltup in 2021.
__________________________________________________________________
TNX will provide a very large indication as to how the preset Wedge on the ES/NQ
resolve, likely this week...
Keep it in purview at all times, sudden violent reactions are to be expected.

U.S. 10yr Yield driving marketsStochastic %D is headed lower on all three charts. I will probably remain bearish until SKEW and fear/greed indicators signal "time to buy"
Left chart:
> daily 10yr yield may be a double top and it comes down from here
> markets are positively correlated with yield movements for now
> yield is at 200ma resistance on weekly chart
> yield will respond - how? - to Fed balance reduction and no more asset purchases
Top right chart:
> 30min chart of 10yr yield shows 1.71 is critical level
> there is a lag between yield and market movement, so swing trades will work well
> lower yields may initially cause markets to rise, so be ready for market turns and take profits
Bottom right chart
> 30m chart of Dow Jones is an example of markets heading lower to retest lows
> when you look at daily/weekly charts, it is likely that markets move even lower
> stocks that look "sold off" on 30m/daily still have room down on weekly
> at the same time, markets may bounce first on lower yields, as there is room on daily to move up to 20sma

TNX - 10 YR T-Note Yield - Overblown?This thing is way ahead of where quarterly money flows suggest it should be - I think it will pull back and consolidate 1.10 - 1.150 range. Also looks to be exhibiting the same post-crisis recovery that it followed after the GFC. I'm pretty sure all of these anti-fed pumpers were out there barking about it back then as well.
Also, Bitcoin (all cryptos) still look like crud, barely hanging on minus over 30% and still tired.
Stocks looking real good in terms of quarterly money flows. This recent pull back looks like profit taking to me (maybe another 5% down and reverse but I think we are near the end of the correction. Oil also holding up and actually creeping higher, suggesting demand remains (for now); again, we know that the American consumer IN 2007 - FIFTEEN YEARS AGO - was able to support $100+ / barrel oil. Today we are tickling $86 / barrel.
Fear sells. Listen to the data.
God Bless.
#GoChiefs!

𝟭𝟬-𝘆𝗲𝗮𝗿 𝗗𝗮𝗶𝗹𝘆: $TNX Daily. Resistance HoldingPossible the market has gotten ahead of itself on the rate rise? 4 hikes fully priced in already. Ascending channel at key resistance area
$TLT $ZN_F $ZB_F $TYX $DXY $SPY $VIX $QQQ #Tech #Rates #Trading

TNX ProjectionsBased off this *very* well respected weekly channel on the 10 year, I do believe 2.0-2.5% is quite possible, if not likely.

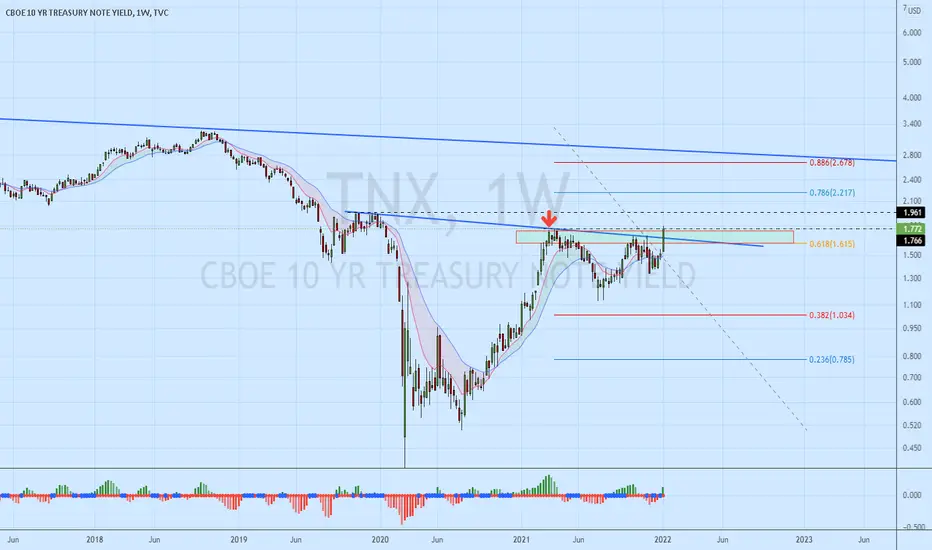
TNX at key levelTNX is attempting to breakout from the 618 resistance and above the Mar 29th high. This is what has the market worried. The targets above would be 2.21 and 2.67 so the market is pricing in growth at these higher rates. It is still possible for the TNX to reject here and fall back down. I will be watching for the rejection as it would likely give a boost to growth stocks and tech.
US 10yr stalling at recent highsStalling at recent highs
Tech bulls want 10yr to sell off
Value/cyclical bulls want 10yr to rally

$spy $tlt $tnx Short-term reliefYou may get some additional downward movement in rates which eases stress on markets....In the short-term, but the march to 1.94% will resume. Plan accordingly

TNX - Clear indication of a Pullback10 Year Yeidls should begin to pull back, this will provide a
welcome wind for TECH into EPS Season.
Bond VX is retreating as well.
RSI/STO Summation indicates an overbought condition.
____________________________________________________
Seemingly - this implies our thesis for the Recac has come into
the Trade and was supported by the Short Squeeze and Gamma
Call Squeeze after the Put Close.
Jumbos want to make $, it is axiomatic the ranges will expand and
Profits can be made on ALL sides of the Ranges.
It is that simple.

10 yr yield to see 1.75 to 1.86 at 50% TOPPED The chart posted is that of the 10 yr yield A few months back my forecast was for a move backup to 1.75/ 1.86 into the 50% area . I stand by this being the TOP of the range and we are now set up for deflation to show up . the 10 year will not be moving up for sometime
the 2000s yield fractal2003-2007 yield fractal may be repeating right now which means rates will be rising for the next couple years

TNX - Monthly Historical Chart 40 Year ChannelThe Event which will provide relief to the Bond Complex is the Federal Reserve
walking back its most recent Policy Statement.
The Short End of the Curve witnessed an aggressive move of 6-9 Bips. This doesn't
appear to be much on the surface of it.
Unfortunately, it is.
______________________________________________________________________
The Yield Curve is not effectively communicating at either end and throughout the
Curve.
Far too much is made of prior Paradigms, with a real lack of understanding of the Glacial
movements in the Bond Complex.
40 years is a long time - an unparalleled Bull Market in Binds coming off the Volcker Era
after the Whip Inflation Now Era.
Price in trend - it remains in Trebbt as the sheer largess of the Bond Market is 11X that
of Equities.
_______________________________________________________________________
The Risks remain to Rates rising.
Hopefully - there is not a disorderly eruption as it would wreak havoc in ways we have
not seen in a very long time.
