US BOND Market ROUGH CORRECTION Q3 ?Us bond market failed the initial demand zone & drop 8 % in 2nd quarter & recovered, might visit the extreme demand zone in coming Q 3 which is around 9 % drop
US05Y trade ideas

US05Y Bond LongUS05Y Bond is now Net-Long on the Regression Break.
I am considering a Bond Trade with the markets under pressure.
US05YThe US bonds are in a very strong sell , The've been a third bounces to the downside and also a break out trendline to the upside

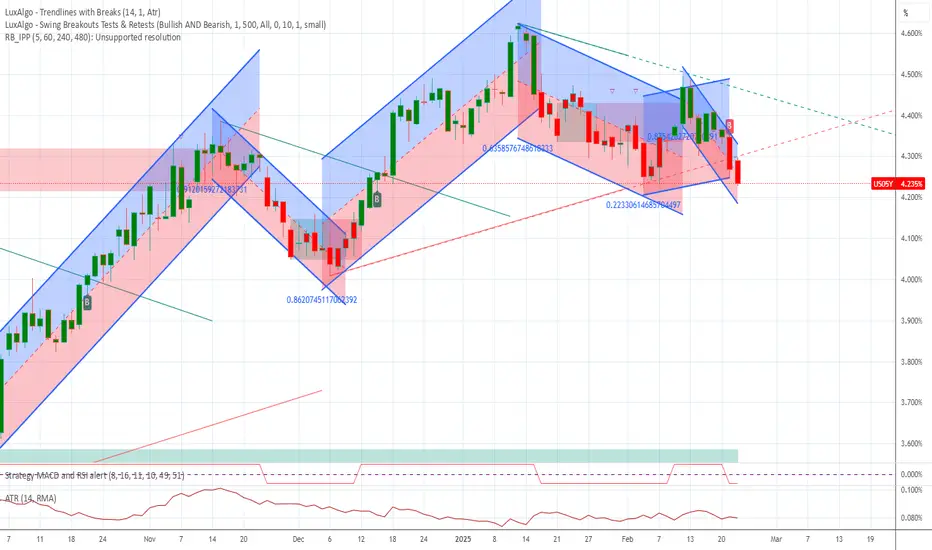
US05Y Bond Short on Regression BreakUS05Y is now net-short on regression break.
I will consider this pair as price action develops and decide which EA is suitable.

US05Y Bond Long on Regression Break.Bonds rates have moved consistently moved higher and now the US05Y is net long on the regression break.
US02Y and US10Y are close to following suit.
Maybe the start of a bond market conditional move.

US05Y Long but wait 3%now its break a major support and retesting it at 3.8% now its time to fall to 3% then fly back to 7.6%
the move from 3.8 to 3 its important time all us stock going to raise before the massive drop .
this my idea its not a financial advice .

US05Y - Retest on monthly bases then the biggest move ever.US05Y - Retest on monthly bases then the biggest move ever.

stocks bearish for a bitVIX and bonds both point to pull back season on the stocks , 5Y still gotta break above more to be bullish but it wont be much of a problem the way its acting as of now . easy easy conviction play i believe

3 Month Bill Drops To 5.3%In this video, it was difficult to explain everything
--
The first thing we look at is the
3-month bill the price of this bond
--
Is set to drop as of this writing
Later the price will be baked into the market
--
In about 4 days from now
This is very important to understand
--
Because the financial market is backed by
Bonds
--
Once you understand bonds then you will learn
How you can well profit from this type
of market psychology
--
Watch this video to learn more
--
Disclaimer: Do not buy or sell what i tell you
to buy or sell do your own research before you trade
This is not financial advice
--
To learn more about this topic rocket boost this article


5-year US Treasury Yield Working with Long-Term and Medium-Term In the previous Weekly Market Insight, I directed the technical spotlight to a long-term harmonic equivalent AB=CD bullish structure on the 5-year US Treasury yield weekly chart in a market trending higher since August 2020. The AB=CD zone, as you can see, has offered this market a technical floor since mid-March, denoted by the 100% projection at 3.243%.
What’s interesting, though, is on the daily timeframe we can see that the reaction from the weekly AB=CD floor has carved out a daily equivalent AB=CD bearish pattern at 3.757%. This, coupled with Wednesday’s bearish Shooting Star candle pattern and nearby dynamic resistance derived from the 200-day simple moving average at 3.700%, could be enough to motivate a downside move this week to test at least the 38.2% and 61.8% Fibonacci retracement ratios (derived from legs A-D) at 3.558% and 3.437%, respectively.

16/04 Journal: BondsBonds at support
Could mean weakening risk on environment
One piece of the puzzle

Rates Obsession - a pro interest rates set-up on TradingView Interest rate pricing has a huge effect across many financial markets at present – the correlation between short-term rates, rates volatility and the USD is certainly evident.
However, with such a big window for increased volatility in interest rates pricing, as traders try and price the prospect of a 25bp or 50bp hike at the 22 March FOMC, as well as peak fed funds pricing, could increased pricing result in a big move in the USD and NAS100?
In the video, we look at how we can look at the fed funds curve and understand ‘what is priced in’ – we look at how to measure the degree of cuts priced in for a specific period of time, and how to look at implied volatility in bond markets – and, why it is important for FX and index traders?
Interest rates and short-term US Treasury bonds are the first derivative and so many markets take their direction from these inputs - hopefully, this gives some understanding of how you can use TradingView more effectively to assess these inputs.

what do you think about 5 years breakeven ratehi all
as you know this will efect directly on crypto and because of this i did this analysis
so i think it will drop to the red area
what do you think ?
The information provided on this Page does not constitute investment advice, financial advice, trading advice, or any other sort of advice and you should not treat any of the website's content as such. this page does not recommend that any cryptocurrency should be bought, sold, or held by you. Do conduct your own due diligence and consult your financial advisor before making any investment decisions

Opportunity For Gold Is Coming IMOI think once in a lifetime opportunity for gold is coming soon. Hope you guys appreciate the chart.

US05YWhenever trendline provides resistance twice the price is destined to fall down as it can not deal with such heavy resistance

What is wrong with USA marketI now expect the US05y bond market to go down. Interesting that I trade short US500 down and many US companies. Where will the money flow to?

US05Y : Still standingIt all seems that the 30s, 10s and 07s had all fallen below the EFFR.
Now, it is the turn of the 05s. But I think it should also FALL soon.
The implication?
Looks like the Fed rate hike is coming to an END. If there is a further hike of 50bps next month as ANTICIPATED, this would potentially put ALL the yield curve below the EFFR. And that might be a POLICY error that many are saying the Fed is committing.
The Dollar will likely FALL.
The Euro will likely rise. Of course, this rise is subject to the ongoing WAR in Ukraine. If it does not stop by the 2Q2023, we shall see what is in store for the entire EZ. The EZ budget is already stretch to the limit because of the policy of 'energy suicide'. It things continue as it is, the EU economy will completely collapse. Industry will shutdown, euro in free fall, inflation and debt will rise.
Good luck. And have a nice weekend :)
P/S : As always, do not just believe what I say. Use your common sense.

US05Y H8: UP TO PP, THEN DROP TO S1 - Looking for US5Y-Yield to move above DEC Monthly Pivot
- Followed by a drop to DEC S1 = GAP
- Dollar-Index should follow Yield and weaken after 1st week of DEC

More upside for Treasury Yields The treasury yields have been in a decline for many decades, on the other side we have a very unique situation in the equity market. We have over evaluations in many markets, especially in the tech sector that was fueled by the billions of dollars pumped into our economy during he pandemic. The interest rates were heavily suppressed and this country experienced the lowest multi-decade interest rate environment in history. Like a charged spring it was ready to burst; we can see the bottom being reached in August of 2020 as everyone rushed to buy, refinance, take loans, buy cars and borrow more debt with the assistance of the stimulus payments. Of course this caused inflation to go through the roof.
Looking at the chart from an Elliot Wave perspective, keeping it simple and clean to understand, we can see an incomplete sequence with a beautiful extended 3rd wave, that is currently in progress of finishing wave "v" of the "(3)". I then expect a sizable 3 waves or triangle pullback down for wave "(4)". After the wave (4) pullback the sequence will still look incomplete and I will expect another wave (5) to the upside and into 2023. This will surely way heavily on mortgage lenders, those looking to buy a home, auto, or take out any new debt. Suddenly a 5% rate on US05Y becomes realistic. I expect other US treasury bonds like the 2, 10, 20, 30 year to rise and have similar wave structure as well.

Could reach 5% April May 2023If Fed continues to hike AND shrink balance sheet therefore doing demand destruction then credit will be So Tight that US economy will contract and present recession will become a Depression.
Such a conditions could make Nasdaq drop another 20% and SPX another 12% from present levels

Future interest payments will skyrocketThis shows expected interest payments as a moving average divergence around current interest payments which acts as a moving average that is delayed by one to two years. Anyways, the current "future" interest payments as calculated by the US05Y yield have never had a larger divergence from current payments. It is expected that in one to two years, US interest payments on the national debt will be more than 30% of tax receipts (see FRED:A091RC1Q027SBEA/FRED:W006RC1Q027SBEA)

5 year yields probably topping out5 year bond yields in the US look like they might be topping out.
Incurs a negative bias on the wider economy.
Return to the historical trend around the yellow line?
