US10 & US02 YIELD CURVE vs USDJPY / BTCUSDHighlighting the risk on/off to the yield curve vs USDJPY & BTCUSD.
US10Y trade ideas

Inverted Yield curvefor 711 days!!!! Stay tuned!!!!!More than 700 days with the inverted yield curve. This duration has never been seen!!!! Be careful!!!

BTC > NDX. Risk waning again?During the last few weeks the NASDAQ:NDX has been trading closely to $BTC.
In fact, dare to say that #BTC is LEADING!
Risk is waning again. We see #yields are dropping but are now at RECENT SUPPORT LEVELS!
TVC:TNX
Let's see how the next few days go!

Small caps about to rip?Could be the start of a U.S. 10-year rate breakdown. It's about time the small caps shine. AMEX:IWM / TVC:RUT could rip soon. 💥🚀
NASDAQ:RKLB NASDAQ:SOFI , let's go!

Build a bond
All ideas are strictly my interpretation of price action. I am not a professional trader nor is this
professional advice.

TNX 10 year note here we go againThe ten year has done a double pump each time it collapsed. This time it has hit its second top, and down we go to its 50% fib, or there abouts, just as it has in the past.
Election coming, gotta make thin gs better than they seem and are. Lower rates in July .25, just a start, then another .25 in September, and then another in November. If they wait until September, the effects of lowering wont be felt by real estate in time to have the affect they want on voters.
Commodities will surge, because inflation is still not under control, and this will actually make that worse. In fact it will cause home prices to surge up also. And with brics hitting in October, Gold is gonna skyrocket, silver follows.
Idiots. All to stay in power, and cover all the lies with that power, and by that power. They cannot afford to loose. In fact if this doesn't work, along with stimming the economy also with easy to get HLOC loans starting in July (yep Freddie Mac gonna back second mortgages - to squeeze every last drop of equity out of those inflated priced homes - wait didn't we do something similar in 2008?) , its WW3, to cover it up and delay elections.
What a world. God bless us all.

Treasury Yields Search SupportYields on the US 10-Year seem to have broken the January uptrend, threatening another test of key support at 4.26/32 - a region defined by the 52-week moving average, the 1998 low-close, and the 61.8% retracement of he 2000 Decline. Look for a larger reaction there IF reached with a break / close below needed to suggest a larger reversal is underway here.
Resistance now eyed at the yearly high-week close (HWC) at 4.66 with a breach / weekly close above 4.75/83 ultimately needed to mark uptrend resumption.
Michael Boutros
@MBForex

The Bond DilemmaThis is a simple setup resulted from the analysis, processing, and simulation, of several future scenarios that might unfold. The rectangles are projected support and resistance zones where the price might hit a bump, create a turnaround, or halt it's actions into a consolidation zone, before continuing on its initial path. The small orange one marks a potential milestone for a scenario in which in case it is hit, and only in this scenario, a pivot point might be expected at the marked time stamp. The marked price level is also relevant in case a correction is formed near it, leading to a potential end of it, with a candlestick potential reversal pattern that can signal an opportunity to jump on the action of the next wave.
We use Japanese Candlesticks in our analysis to compute the tendencies of the market, the sentiment, the overall context of each wave, but also to assess any potential weakness in a wave (useful and required for position management), or a complete reversal.
While the obvious scenarios in which a turnaround can occur at the upper rectangle, a bounce from the red one, or an incursion towards the big green one, might sound appealing to us, we must also not limit ourselves to such scenarios and keep an open mind for any other opportunities signaled by the candlestick analysis, and the overall context of the flows and events in the market.
As usual, this project will be followed by short updates for milestones, highlights, or potential red alert scenarios (pivot points or reversals). Trade with care, and may the force of profits be with you!

Yields selling off, US Dollar weakThe 2Yr Yield has cratered since our last post.
As has the 10 Yr #yield $TNX.
The pattern breaking, whichever direction, will give us an indication of the likelier direction that #equities will go.
Is the US #Dollar giving us an idea?!?!?!
You'd think CRYPTOCAP:BTC and AMEX:GLD would be moving better with the selloff of $DXY.
Saudi watch...

ZB vs US10YZB - Closures in the VOID previous suggest price will most likely seek higher since this area is "balanced" already
US1OY - Nice rejection after getting the higher prices we expected last week.
Reasonable to assume we could get a closure below the VOID in discount this week

Trade Like A Sniper - Episode 14 - US10Y - (3rd June 2024)This video is part of a video series where I backtest a specific asset using the TradingView Replay function, and perform a top-down analysis using ICT's Concepts in order to frame ONE high-probability setup. I choose a random point of time to replay, and begin to work my way down the timeframes. Trading like a sniper is not about entries with no drawdown. It is about careful planning, discipline, and taking your shot at the right time in the best of conditions.
A couple of things to note:
- I cannot see news events.
- I cannot change timeframes without affecting my bias due to higher-timeframe candles revealing its entire range.
- I cannot go to a very low timeframe due to the limit in amount of replayed candlesticks
In this session I will be analyzing US10Y, starting from the 3-Month chart.
- R2F

US 10Y back to 5.00%?Similarly to the DXY, the US 10-year yield is showing signs of also setting up for another leg higher which will allow yields to climb back towards the 5.00% handle. The mainstream narrative however is that yields has peaked but another fresh US bond sell-off sparked by global geopolitical tension could easily allow yields to spike higher.

US 10Y TREASURY: more volatility ahead?The 10Y US Treasuries exhibited some higher volatility during the previous week. Nervousness prior to the release of the PCE data was evident, when yields reached their highest weekly level at 4.62%. However, as the PCE was fully in line with the market expectations, yields cooled down a bit until the level of 4,50% for one more time.
Shifts in investors sentiment will continue to be impacted by broader economic conditions and market forecasts, in line with significant policy developments. Economic data which will be posted in the week ahead are non-farm payrolls and unemployment data for May. In case of any surprises on this side, the market might react again with a new jump in Treasury yields. However, in case of no-surprises, the yields should continue their relaxation. Still, the first Fed's rate cut continues to be the major topic on financial markets for the future period.

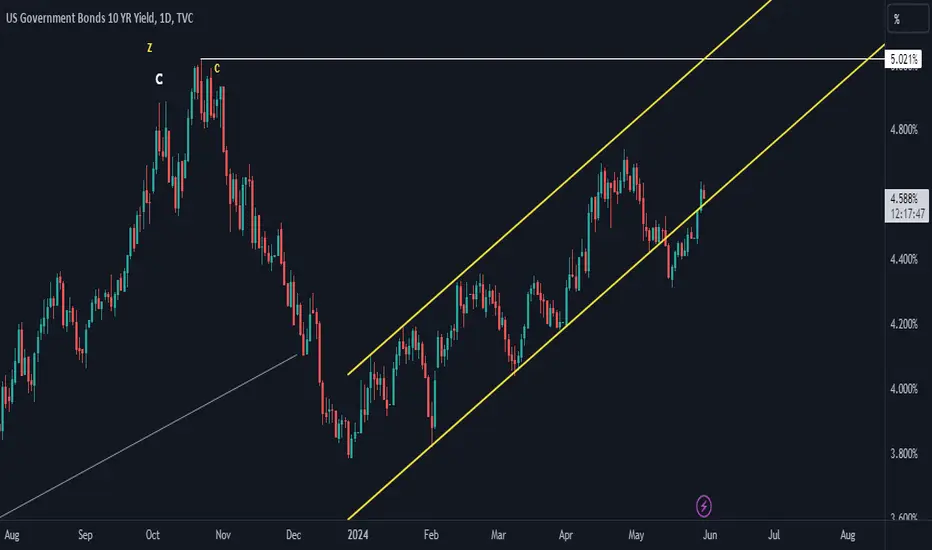
yellow channel breakout retest and rate cutyields went up inside a yellow channel
now testing lower yellow line after breakout
since rate cut are will begin soon so after retest of lower yellow line it can make new lower low
Forecasting the US 10-Year Yield: Insights for Q2 and Q3Traders, as we navigate through the second and third quarters, understanding the potential movements of the US 10-year yield TVC:US10Y becomes increasingly crucial. Join me as we analyze the factors shaping the bond market and anticipate the trajectory of the 10-year yield in the coming months.
I'm excited to share a comprehensive outlook, encompassing a short-term surge to 4.625%, a subsequent retracement to 4.3%, and finally, a bold move up to 5% by the end of July.
TVC:US10Y
Prepare for market turbulence! With inflation data grabbing the spotlight, brace yourself for a potential seismic shift in the financial landscape. As inflation data becomes the talk of the town, all eyes turn to the US 10-year yield TVC:US10Y , which stands on the brink of a surge towards the pivotal 4.625% threshold.
We're in for a wild ride as inflation data takes center stage and sets the stage for market volatility.
Reasoning:
Economic Recovery Outlook: Assessing the pace and trajectory of economic recovery will be paramount in forecasting the US 10-year yield. Keep an eye on key indicators such as inflation rates, GDP growth, employment figures, and consumer sentiment surveys.
Inflation Expectations: Rising inflation expectations can put upward pressure on bond yields as investors demand higher returns to offset the eroding purchasing power of their investments. Monitor inflation data releases and central bank statements for insights into future policy actions.
Profit-Taking Opportunity: In anticipation of the yield surge, I'm eyeing profit-taking opportunities on USD pairs. The heightened yield environment could attract investors seeking higher returns, driving up demand for the USD in the short term.
Inflation Data Surge: As inflation data takes center stage, the US 10-year yield is poised to surge towards the critical 4.625% threshold. This anticipated increase in bond yields is likely to trigger a ripple effect across the forex market, particularly impacting USD pairs.
Global Economic Trends: Global economic trends and geopolitical developments can also impact the US 10-year yield. Factors such as international trade dynamics, monetary policy decisions by major central banks, and geopolitical tensions can influence investor sentiment and bond market movements.
As we journey through the second and third quarters, let's stay proactive and informed to capitalize on opportunities in the bond market. Join the discussion as we navigate the intricacies of bond yield forecasting! #US10YearYield #Forecasting #BondMarketAnalysis 📈📉💡

us10y bondslooking at the us10y, looking for a reaction zone at 7% as she continues to climb testing key resistance at this time. #us10y #bonds #stockmarket #investor TVC:US10Y


Interest Rates look decently strongThe 2Yr yield has paced itself recently.
The 10Yr #yield is picking up steam.
Both went from a bearish moving average crossover, circles, to a bullish
(Data not seen here, more info in profile)
2Yr is almost @ last years bank failure rates.
10Yr has been trading mostly above.
Weekly
2Yr looks like it wants to skyrocket, if breaking out of the ascending triangle pattern.
10Yr has been treading higher, along its trend line. TVC:TNX
Fed is in a catch 22. Cannot raise rates, more things will break BUT it but cannot lower, inflation.

US10Y Bouncing US10Y is looking like it is going to make its next leg up soon. It bounced off the MAs a couple weeks ago (which corresponded to the previous high in Oct 2022) and is moving up quick.
Something about today's price action with equities and NVDA is giving me an inkling that US10Y will be moving up throughout the summer, targeting the 5% level again.

US Bond Yield 10 year VS NASQAD US Bond Yield 10 year show continue uptrend but NASQAD show timing end uptrend.

US10Y - Down To Go UpLast week was packed of rangebound action but Wednesday was the day that changed the market structure, shifting to the downside.
Expecting a relief rally upto 4.450%

Show me what you gotAll ideas are strictly my interpretation of price action. I am not a professional trader nor is this
professional advice.
I will continually update all trades.

🌕DOOMSDAY POST #236🌖 : THE GREAT RESET🌗MAKE OR BREAK🌒Okay lets break it down
☄️ ☄️ ☄️ ☄️ ☄️ ☄️ ☄️ ☄️ ☄️ ☄️ ☄️ ☄️ ☄️
Technical analysis is a very important factor in prediction, despite the fact we like to downgrade and bruise the egos of traders who are overly reliant on it
of traders but lets put the jokes aside its all just data and interpreting it is the objective
history repeats itself simple
That said im going to be predicting the coming interest rates by predicting the TVC:US10Y (similar beta in trend) which will lead to strengthening TVC:DXY and large capital outflows from emerging economies experiencing foreign investment boom resulting in one big financial doo-doo aka RECESSION
i know nothing new under the sun and i 100% live by it, but with the amount of new variables to filter in i feel like this might be bigger than we anticipate or might just be brushed under the rug as if nothing happend after experiencing a big retracement of sorts in the markets but not big enough to lose our shxxs
the significance of the variables as a result of their magnitude is what concerns me
and their impact to the panic which i also suspect could work in the markets favour for some reason
WARS and the increasing division among allied nations
Market liquidity (more participants)
Social media and changing social standards (the consumers livelihoods)
US debt ceiling
US Real estate mortgage rates
Shift in power dominance (China)
LET ME KEEP IT SHORT 4 NOW
