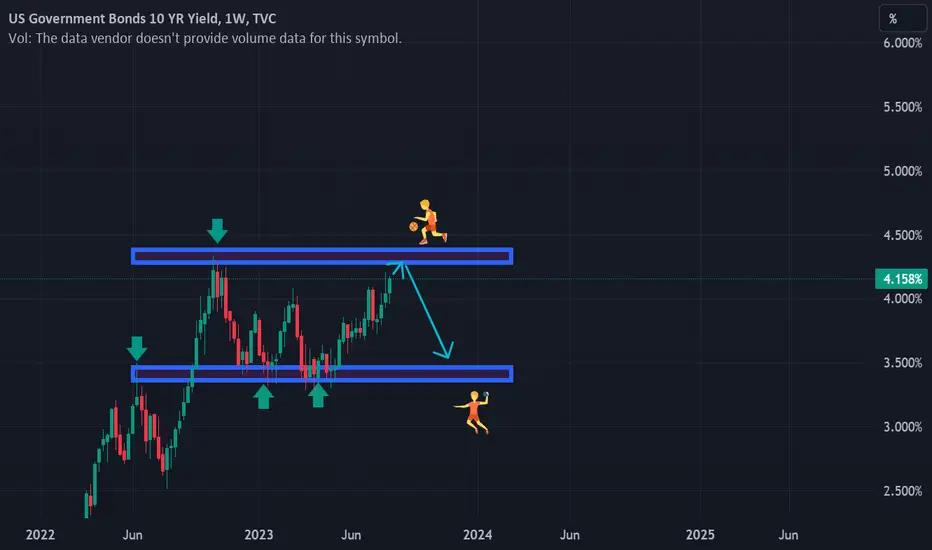
faith of US10Yafter gold sudden bullish price volume from demanded price we could see price is rejecting ceiling price from US10Y
US10Y trade ideas

This chart pattern suggests yields are going higherUS10Y remains in an established uptrend on the daily chart, and Friday's bullish engulfing candle suggests a swing low has formed and more gains are to follow.
But having looked back at price action since the April low, we note that prices are yet to break the low of a bullish engulfing candle if it has formed after a pullback or period of consolidation. Granted, there are one or two of those engulfing candles that do not fit the exact description (as an open or close is out be a few ticks, meaning it has not truly engulfed). But we've relaxed the rules to note bullish candles that show clear range expansion over the prior candle.
And if that pattern persists, it looks like the 10-year yield (and likely yields across the curve) are at least going to make an attempt to retest or break their cycle highs.

us10y for gold bearish faithbasic inverse correlation towards the for XAUUSD.expecting bullish leg after bullish formation of basic price structure.

US 10-Year Yields Threaten Uptrend ResumptionA massive outside-day reversal off confluent support is now approaching a key resistance zone at 4.22/24 - look for a reaction there IF reached.
A topside breach / close above is needed to mark resumption towards 4.33.
Broader bullish Invalidation now raised to the 50-DMA (currently near ~4%).
@MBForex

US10Y Rejection not confirmed yet. Bullish unless this breaks.The U.S. Government Bonds 10YR Yield (US10Y) is having a 2-week rejection since the August 22 High that was priced marginally above the 4.336 Resistance. However both the 1D MA50 (blue trend-line) as well as the Higher Lows trend-line that moves just below it, remain intact, maintaining the long-term uptrend.
Today is the ideal spot for a new buy entry, targeting 4.365 (August 22 High). We are only willing to turn short after the price breaks below the Higher Lows trend-line and closes a 1D candle below the 1D MA50. In that case, we will sell and target 3.810 (Fibonacci 0.5 level).
Notice also the 1D RSI which just hit its own Higher Lows trend-line that is holding since March 15.
-------------------------------------------------------------------------------
** Please LIKE 👍, FOLLOW ✅, SHARE 🙌 and COMMENT ✍ if you enjoy this idea! Also share your ideas and charts in the comments section below! **
-------------------------------------------------------------------------------
💸💸💸💸💸💸
👇 👇 👇 👇 👇 👇

US 10Y TREASURY: targeting 4.0%?The pivotal point for markets during the previous week was the release of the unemployment rate in the US for August. The rate was increased above market expectations to the level of 3.8%. This was sort of a surprise for markets, where the majority of participants revised their estimations, anticipating that Fed will not hike rates at September`s meeting. The odds for such a decision are currently very high, reaching 93%. Treasury yields also reacted with modest relaxation. The 10Y Treasury rates made a move from 4.25% down to 4.063% as of the end of the week.
Current charts are pointing to a higher probability that 4.0% might be the next target for 10Y yields. This level might be tested in the week ahead. A move toward the opposite side might lead to 4.20% which could be tested for one more time

10 Y Treasuary Up by +1.7%How can you tell whether a price is in
an uptrend?
--
In this video we tackle this question
--
To learn more
watch it now
---
Disclaimer:
Do not buy or sell anything as this not financial advice please
do your own reasearch before you trade
--
Cheers,
Lubosi Bonds

The Bear Steepener Analysis US10Y/US01YLooking ahead to the upcoming week and my market outlook:
Let's begin by examining the yield curve spread, which consistently correlates with the bear steepener. This spread provides us with a valuable timetable or countdown, usually spanning 1-3 months before a breakout occurs. When this breakout happens, it typically signifies that the market has already shifted towards a risk-off sentiment.
Similar pattern consolidations/breakouts occurred during most recent systemic risk offs, below is the one we've had during Covid:
Dot Com
s3.tradingview.com
2008
With the only exception, a major fakeout being the 1995-1998 period.
Now, when we consider the VVIX/VIX ratio, it offers a noteworthy perspective on the potential alignment of this bear steepener breakout with the possibility of breaching the bottom support. Barring any unforeseen developments that could disrupt this pattern, it appears that we are receiving indications or early warnings of an impending risk-off event.
Additionally, when we look at stocks above the 50-day moving average (MA), it confirms our decision to shift towards the long side just over a week ago. Moreover, there's a chance that this move could trigger a final squeeze. How long might this squeeze persist? My assessment suggests that it still has some room to run, and I would only recommend exercising caution once we start approaching the 60's in this particular indicator.

US 10 YEAR TREASURY NOTES ANALYSISThere is a strong relationship between bonds and equities. Recently, specific stocks such as APPLE and MICROSOFT have been retracing from their all time highs. There is a continual flow of money between the equities and the bonds ( like two poles on the opposite of each other ). If the bearish momentum in the equities continues in the coming weeks/months, the money will flow into the bonds, and the bond yields will fall as a result !
US 10Y Treasury yields looking vulnerableUS 10Y Treasury yields look to have completed an ending diagonal. Price has broken out of the pattern and looks under pressure.
Momentum and RSI indicators are weakening.
short to medium term bearish outlook as a result.
A move above the red line would invalidate the outlook.

US10YHi, every body listen to me please you can use Technical analysis everywhere no matter in which market you are trading just you need price and time and volume and liquidity.......
see the price action in us10y that is interesting big spike up in commodities .....if you are using my prediction please share them to your friends and family members.....
MY LAST ANALYSIS LINK :https://www.tradingview.com/chart/US10Y/HLTFy1xJ-US10Y/
ENJOY HERE WITH ME.
GOOOOOOOD LUCKKKKKK

📈📊 #ChartPattern Alert! 📈📊 📈 Rising Wedge 📈📈📊 #ChartPattern Alert! 📈📊
📈 Rising Wedge 📈
📈 What is a Rising Wedge? The Rising Wedge is a bearish chart pattern characterized by two converging trendlines, with the lower trendline sloping upward more than the upper trendline. It typically signals a potential bearish reversal, with the price likely to break downward after the wedge pattern.
📈 How to Identify:
Draw a trendline connecting at least two lower highs (upper trendline).
Draw another trendline connecting at least two lower lows (lower trendline).
📈 What it Signals: The Rising Wedge suggests a potential bearish reversal, with sellers prevailing at lower highs within the wedge. It often forms during uptrends and can precede a significant price move to the downside.
📈 Trade Strategy:
Consider short-selling or setting stop-loss levels if the price breaks below the lower trendline of the Rising Wedge.
Set profit targets based on the pattern's height subtracted from the breakdown point.
Implement a stop-loss to manage risk in case of a false breakdown.
Remember to use other technical indicators and conduct thorough research to support your analysis before making any trading decisions. Happy charting and trading! 📉💹

US10Y - Toppy CluesIn tandem with dollar, 10 year yields are giving toppy clues.
Last weeks candle printed a shakeout through the 2022 top.
And this could be the deeper perspective of the textbook "double top."
And now this week's candle is printing bearish so far.
Its actually picking up pace as I write and I have just entered a TLT Bonds long.
So I did say this could be climbing into the next wave up but the mid trend shakeout I have highlighted (notice on the 2 week chart there is the blended shakeout with large upper wick) does not support this and it look like it may be ready to collapse.
We'll see but if it does then it could be the explosive moment we've been waiting for in asset markets 🤨.

Macro short ideaWhen the 10y-03m has bottomed, people will seek the 10y security, selling their assets and locking in the highest rate.
This should be on the retest just as in 2000 and 2007 and 2019, also be confirmed closer to 0% difference.
SPX should be able to SFP ATH or just slouch from around these levels.

EURUSD Technical AnalysisUS:
The Fed hiked by 25 bps as expected and kept everything unchanged.
Fed Chair Powell reaffirmed their data dependency and kept all the options on the table.
The US economic data keeps on surprising to the upside, but inflation expectations and CPI readings continue to show disinflation with the last two Core CPI M/M figures coming in at 0.16%.
The US PMIs missed expectations across the board last week, while the US Jobless Claims remained solid.
Fed Chair Powell’s speech at the Jackson Hole Symposium was mostly in line with what he said previously but he stressed on the need to be careful going forward and that continued strength in the labour market may require further rate hikes.
At the moment, the market doesn’t expect another hike from the Fed, but the next NFP and CPI data will be crucial to confirm or change this view.

US 10Y TREASURY: relaxation ahead?During the speech at the Jackson Hole conference in Wyoming on Friday, Fed Chair Powell only confirmed what markets already saw in FOMC meeting minutes – which is that the interest rates might go higher from current levels if the inflation remains persistent. Prior to his speech, the 10Y Treasury yields reached the highest weekly level at 4.358% and remained elevated during the rest of the week. However, some relaxation came as of the weekend, so yields finished the week at level of 4.239%. But the question remains whether this was only a short correction to the downside and if the markets finished with testing of $4.3% level?
Current charts are pointing to the possibility for the 4.3% level to be tested for one more time. This might be supported by the fundamentals which will be released during the week ahead – the PCE Price Index for July and Non-Farm Payrolls for August. Still, there is no indication that yields might go higher from this level. At the same time a short reversal might bring yields back to 4.2% eventually 4.1% levels.

US10YHi ....watch this pretty retrace in US10Y ......i think that is really hard stone above us10y and strong resistance ....
Gooood LucK

us10y yields are ready us10year yields are ready structly to go down wait for the confirmation and go for it

US10Y downtrend correction As my view the US10Y inside ABC correction. wave C end at price range 3.714%
The correction will be invalid if price close below 3.615 %.
we use US10Y as additional tools to analysis the gold.
The relation between gold and US10Y is Inverse relationship.

US 10 Year Treasury vs USD/JPYTLDR:
The US 10-Year Treasury Yield and the closely correlated USD/JPY pair can be determinants or signals of market risk. With both breaking their three decade long trends, you have to wonder is a major secular shift upon us.
The USD/JPY currency pair has traditionally had a close correlation with U.S. Treasuries.
The pair shows how many yen are required to buy one U.S. dollar
The pair's exchange rate is one of the most liquid, not to mention one of the most traded, pairs in the world. That's because the yen, just like the U.S. dollar, is used as a reserve currency.
When yields on Treasury bonds, notes, and bills rise, the Yen tends to weaken relative to the dollar. When interest rates head higher, Treasury bond prices go down, which lifts the U.S. dollar, strengthening USD/JPY prices
The US 10-Year Treasury Yield and the closely correlated USD/JPY pair can be a determinants or signals of market risk. With both breaking their three decade long trends, you have to wonder is a major secular shift upon us.

Just Take Attention 1day basis followupWhen US 2Y passes over 10Y, that might sign something is wrong. Not calling recession however it says something might be wrong. Take attention while FED continues to US dollar burning and interest rate hiking.

Just Take AttentionWhen US 2Y passes over 10Y, that might sign something is wrong. Not calling recession however it says something might be wrong. Take attention while FED continues to US dollar burning and interest rate hiking.

Reversal Bars Part 4-1: Springs and UpthrustSpring and Upthrust:
In the first three parts of this series (linked) we covered the basics of reversal bar patterns including hooks, pipes, key reversals, and climaxes. In this piece we focus on springs and upthrusts. Historically these patterns were associated with trading ranges, but I find the concepts useful anytime a market tests significant support or resistance. This is particularly true in the modern environment in which price indecision resolves itself more quickly and trading ranges are less frequent. A spring or upthrust bar often signals a significant reversal and makes it clear that a change in the supply demand imbalance has developed.
The patterns covered in the first three parts mostly occur near the end of uptrends and downtrends. In this part we cover patterns that often mark the end of lateral trading ranges or tests of already defined lateral support and resistance zones. We will focus mostly on tests of defined support and resistance, spend a bit of time on trading ranges and take a quick look at the technical position of the 10-year Treasury in its trend to illustrate some of the concepts.
Definitions:
Spring: Price thrusts sharply below a trading range/prior low support level (often in reaction to bearish news) before quickly reversing and closing back above the violated support. The quick reversal traps bears who entered fresh shorts in the belief that the prior downtrend was resuming. Volume on the spring is typically quite high (the higher the better) and the price spread should be reasonably wide. To qualify as a spring, the reversal must occur quickly. Slower violations that fail can be thought of as washouts or bear traps.
Upthrust: Price thrusts sharply above the trading range/prior resistance level (often in reaction to bullish news) before quickly reversing and closing below the violated resistance. The quick reversal traps bulls who entered fresh longs in the belief that the prior uptrend was resuming. The volume on the upthrust is typically quite high (the higher the better) and the price spread should be reasonably wide. To qualify as an upthrust, the reversal must occur quickly. Slower violations that fail can be thought of as washouts or bull traps.
For simplicity we will focus on springs rather than upthrusts, but functionally there is little difference, other than the fact that springs, which occur at bottoms, are often more violent than upthrusts, which occur at tops. These behaviors often develop as the market tests a strong support or resistance. As in prior reversal bar examples, the structure often marks a meaningful change in the supply demand balance.
Spring patterns typically develop in reaction to news or fresh bearish information that pushes the market sharply below support. But after the initial reaction below the range/pivot lows, fresh selling fails to materialize. The lack of new supply signals that the immediately available supply is exhausted. The quick rally back inside the range traps new shorts and generates significant covering. Typically, the time spent below support is very brief.
Springs reveal the nature of the supply waiting below the trading range or pivot. If a market springs a range, finds no new supply and rallies back inside the range or above the pivot, it can be assumed that the range has cleared out the supply leaving the market is now free to rally. Generally speaking, springs should reverse at a reasonable level and do so quickly as new sellers fail to emerge.
The structure is often tested. If a test occurs, it should be on lower volume and will generally be at a shallower angle than the initial decline. In my view, the spring low should not be violated by any significant degree or the structure is invalidated. Initial stops placed just beyond the extreme of the reversal bar should be secure but they are often too far away from the entry to represent a reasonable risk reward and typically are moved aggressively higher.
The depth of the thrust below the support, the volume it occurs on, the chart perspective it occurs in and the aggressiveness of the rebound are all factors when assessing the importance of the spring.
In part 2, we will cover trading springs and upthrusts and spend some time illustrating the concepts with the current 10 year Treasury chart.
And finally, many of the topics and techniques discussed in this post are part of the CMT Associations Chartered Market Technician’s curriculum.
Good Trading:
Stewart Taylor, CMT
Chartered Market Technician
Taylor Financial Communications
