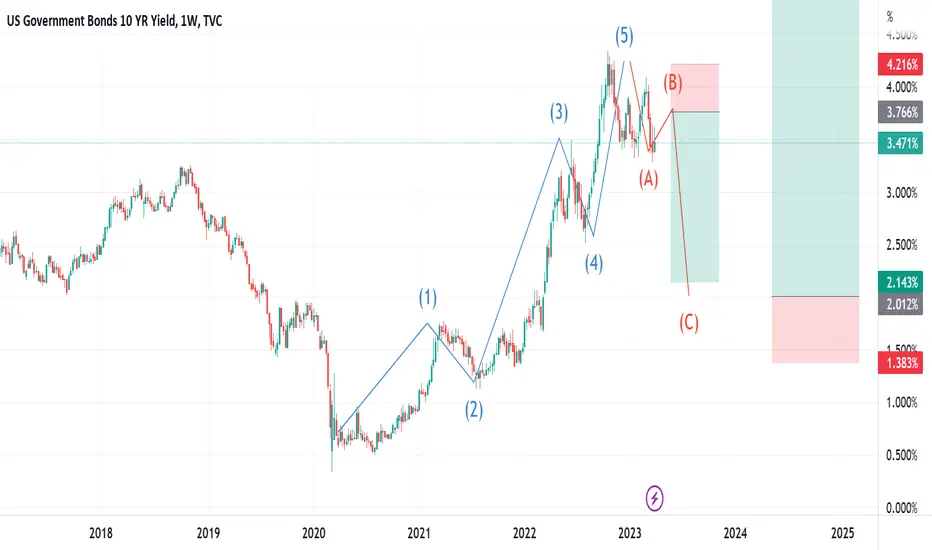
10 Year Yields Topping Out5 wave high completed at 4.25% and now showing potential to see 2.75% on wave C lower in Q2
US10Y trade ideas

That may have been the first break.Update to:
All lines original. No update the analysis/charting, just a follow up to say if this thesis was in play we'd now have held the wave "B" retrace/failed new high and be heading into the corrective C leg. Which would present itself as a capitulation in bonds yields over following big price swings.
US10Y: Rising short term inside its Channel DownThe US10Y is trading inside a Channel Down on the 1D timeframe with the 1D technicals neutral (RSI = 46.172, MACD = -0.046, ADX = 31.478). With the 1D RSI coming off an accumulation that we've seen on the December and January bottoms, we expect the price to rise and approach at least the 0.618 Fibonacci. Our TP = 3.750.
## If you like our free content follow our profile to get more daily ideas. ##
## Comments and likes are greatly appreciated. ##

BlackRock says the market is WRONG ....The World’s Biggest Asset Manager With $9 Trillion AUM, BlackRock are saying that the markets Are WRONG By Pricing In Interest Rate Cuts. There is a divergence between what the Fed is saying that they are going to do and what the markets are pricing in terms of interest rate bets. The Fed is saying “We aren’t going to cut rates”, but the market is focusing on the banking crises and thinks that will force their hand.
BlackRock says the market is WRONG and they don’t see any rate cuts this year.
I think the US 10Y Yield bounced off some key support last week down to 3.25 and currently the market is side lined. There are some very clear levels to watch on the US 10Y yield. But while above 3.25 the longer term up move for the US 10Y Yield is intact and only a close below this level would trigger a correction lower toward 3.00 and 2.80.
#banking #banks #economy #invest #investing #finance #trading #economics #markets

US10Y has not broken the support yet, all eyes on monthly close.It might appear on daily and shorter time frames that US10Y has broken the trend, dating back to 2020.
Weekly at key support level.
it will save the regionals (yield dives due to massive QE, HTM portfolio's MTM improves) or will destroy them (KRE).


10 Yr Bonds - Yields Close to an Intermediate Low10 Year bond yields closing in on a wave 4 low.
I would expect some sort of base building price action before the next leg up. This will provide clarity on the projected completion of this 5 wave pattern.
Yields have recently dropped in a flight to safety surrounding the bank failure panic. Does the stabilization of yields signal that crisis easing? Will the rise in yields negatively or positively impact stocks? What about the dollar, crude oil, gold.... All of these markets are at a transition point. This is a common phenomenon in March... history repeating?

US 10Y yield is eroding a major band of supportIt's pretty much all about Fibonacci today - the market has recent peaked at around 4.24 and is in the process of eroding a key convergence of support at 3.25/3.32 (lows since January, the 55-week ma and the 2018 high). These are looking vulnerable and failure will imply a deeper corrective move lower towards 3.00 and potentially 2.80ish - the 38.2% retracement of the entire rally from the 2020 low.
Remember todays close will also constitute a weekly close on the charts so this should be watched closely.


US 10 YEAR TREASURY YIELD WAVE ANALYSIS (FULL PICTURE)Well well well. If this wave hypothesis is right, then the 10-year treasury yield will be bullish and that the banking crisis may not be over as treasury price is inverse to the yield. Seems very bullish dollar is underway and the 10-yield may catch up with the rate rises. This could also be bearish for gold and the US equities too especially the NASDAQ.
If you like my analysis or they are helpful to you in anyway, please like and follow me.

Long wicks on 10YYThe last few days have seen several candles with long lower wicks on them at a key support level of 3.4%. It looks like yields may rise in the near future (ie bonds sell off).

It's Topped...Only bull traps will follow here ultimately - next one should be an easy short if it comes - Overall this is going down like a stinking bag of bonds over the mid-long term so don't get stuck in it.


US1OY | DXY | DECRYPTERSHi people Welcome to Team Decrypters
Bonds Yield going Down Causing Bond prices Go Down
Which causes Banks to get Liquidated
Investors Moving money from Bonds in to
BTC & Gold
We Expecting 25 BPS

Recession coming "something you didn't know"A negative 10-2 spread has predicted every recession from 1955, but has occurred 6-24 months before the recession occurring, and is thus seen as a far-leading indicator.

US10Y is on the 1W MA50. Major effect on stocks and commodities!It is only 11 days ago when we called for an immediate drop on the U.S. Government Bonds 10YR Yield (US10Y) as it was at the top of both its long-term Channel Down as well as the top of the Diverging Channel Up:
The Channel Up now broke to the downside as the US10Y not only hit our 3.550% Target but closed even below the 1D MA200 (orange trend-line), with the Channel Down remaining the only pattern still valid.
The important development is that the price is testing the 1W MA50 for the second straight day and for the first time since December 21 2021. If it closes the week below it, it not only validates the 5 month Channel Up but also confirms the way for a new long-term downtrend extension towards the 1W MA100.
Needless to say, this will have major consequences on the stock and metals (Gold in particular) markets as well.
-------------------------------------------------------------------------------
** Please LIKE 👍, FOLLOW ✅, SHARE 🙌 and COMMENT ✍ if you enjoy this idea! Also share your ideas and charts in the comments section below! **
-------------------------------------------------------------------------------
💸💸💸💸💸💸
👇 👇 👇 👇 👇 👇

The SVB Collapse and Why It Matters To YouInteresting situation with the collapse of SVB (SIVB), the people have yet to realize we control the market not the central planners. and the collapse of SVB is a realization of that power. So , here is what i know from the very little articles and podcasts that I listen to and I will give you guys the why its important.
From what i know is that SVB business model was somewhat risky in the first place, and their main consumer base was startups, and tech startups. hence the name Silicon Valley portion of Silicon Valley Bank.
Now a little money education... in the world of money and currency (remember currency as current it will become important later) there is a concept called the velocity of money, basically the volatility of money. for my stock traders think the VIX. when the VIX is low there is no money to be made because money is not moving. but when the VIX is high there is plenty of money going around so why not use your dollars as napkins, right or "fun coupons"! this is the velocity of money the faster a person can make money move the more money they stand to make. the banks know this. So when you go to the bank and deposit your check your money is already out the door into something else before you're able to but your wallet in your bag or pocket. this happens because of what is called as the "fractional reserve system" and to be honest its a "F"ed up idea but has worked thus far. what this system means for every dollar you put into the bank, the bank can lend out 10$.
A bank is a business it makes its profits by lending money, and when you save your money it cost the bank money, because of your .01% interest rate. the reason for the big push for open accounts is because the more open accounts the bank has means the more money they have liquid, which means the more they can loan out, which means the more they stand to profit. now as an insurance policy the US government makes the banks keep a fraction of their total account balances on site incase of what they call a "bank run" happens (get to what a bank run is later)
Now, normally you dont notice this or even care because when you go to the bank and want to pull 100$ from your account its no big deal whats a 100$ when your dealing with 100s of thousands. you want a 100$ you get 100$ instantly.
But want to see the system become a problem for you, if you have more than lets say 25,000$ or more in an account go try to pull ALL that money out and see what type of road blocks you encounter. they will make you give ID, reasons for shutting down the account, basically your first born child and your blood type. partly is because they really want to know why you're closing the account, because thats profits walking out the door.
but the main reason is, they have to reach out to sister branches and other banks to pool that money together to be able to give it to you and this typically happens like over night. so if you think you're about to waltz into your local bank and demand a 25,000$ check right then and there you're sadly mistaken. the same exact process happens when you take out a mortgage, now your talking $200K and up so now there are more road blocks. whether you're the buyer or the seller. you sell your house for 500K and you think that check you deposited is there right when you get it... yeah its not!
back to the currency comment money is now a currency it has to keep moving to keep its value. think of it as a river, mostly you can drink water from a river and be okay because bacteria cannot grow in moving water but drink water out of a pond and you just might catch Syphilis (sarcasm intended). money is the same way, the faster you can make it move the more you stand to make and the healthier the money is, if take money out of the river and stick it in your pond as a savings account inflation will eat it alive making it very unhealthy. Even historically before all this crazy inflation started happening the savings rate in a savings account was like 0.01% and inflation was around 2 percent.
Now the importance of this lays with the SVB. When looking at their business model it seems solid... "invest in high beta companies, or higher risk endeavors, then to off set this risk we will load up on the safest paper assets money can buy... the US 10Y bond." Officially the US hasn't defaulted on loans before... i mean we will print more money before we default. I mean it sounds like counterfeiting if you ask me, but who am I just a low key, low level, low volume trader with a computer living in my moms basement :) sarcasm... or is it?!
Well from the looks of it it would seem SVB bought a ton of these 10Y bonds in 2021 when the economy was ripping and roaring. So, when bond yields are down their prices are way up. So in the full swing of the "roaring 20's" yields were around 1.12X or keeping it simpler 1.1XX. so that must mean the value must of been sky high. My only rational thought for this type of purchase was the risk manager must of thought he could off load the bonds in the bond market for a nice profit thinking good times were going to continue. On the surface it seems okay high risk business model with a low risk counter weight.
But "We the People" were leaving SVB, and going back to what i said about taking your 25,000$ savings out, and they were running out of reserves and their bonds were worth less than the paper they were "printed" on, so they filed a loss on their report. on the surface this was fine, because only die hards read a companies 10Q or 8A but all it takes is one... and there is always that one Guy... and not this Regular Guy either. I personally dont like the instability of the tech industry. i mean i do believe we will make a full blown terminator but i dont want to gamble on which company that is regardless of what the gain is... might as well go gamble in my opinion.
So, because there was a mass exodus of accounts they were having a hard time fill orders so file your 8A detailing you're offering more stocks to drum up some money and it falls flat. people read said 8A and see that you dont have cash so the word got out and the consumers made a bank run. Dont get it twisted either this can happen to any commercial bank JP Morgan, BofA, Chase, Citi, Credit Suisse and the like.
a bank run is when the majority of depositors want their money back now and they do it in close succession of each other forcing the bank to say "we dont have your money" so they in essence "run" to the "bank" to get their worthless paper.
Now, what i just learned is back in '08 our amazing government passed legislation basically stating they will no longer bail out banks. (honestly if you guys know the piece of legislation please post it in the comments) I agree with this legislation because when I lost 15k on a bad USDCHF trade 7-8 years ago the government didnt bail me out. that was all my money... just gone in a matter of seconds. So the US government came out and said " we will make sure all depositors will get their monies back...
How?
step in Bail-Ins
And again a bail in is something i literally just learned about... i swear at this point were just making -ish up at this point... ok so we know what a bail out is... basically the US government funnels all this cash into a failing business(s) and the tax payer picks up the tab. so what is a bail-in?... glad you asked
a bail-in is when the depositors pick up the tab...
How?
well the FDIC picks up the first $250K and anything over that 250K is now funneled into bank to help offset the loss.
so if you have $500K in the bank the first $250K is yours... uncle sam gives it back via FDIC (which that money has been long gone spent, so i dont know where theyre going to pull money from to keep this facade of the FDIC up) and the next $250K is the banks... So congratulations you have just become a unwillingly silent partner of a failing bank. -ishy news is that the current administration is trying to give more power back to the IRS and bring it back to its glory days like it was in the 80's so you wont be able to claim those losses on your taxes, if you had a business friendly administration you might actually have a fighting chance.
i have a feeling the whole world is watching what is about to happen, because the entire banking system relies on high value accounts. if the US says tough luck that might send uneasy shock waves to all the high income earners and might make them want to pull their funds out of the banking system...
there is a very interesting article on Credit Suisse that i want to read
so ciao!

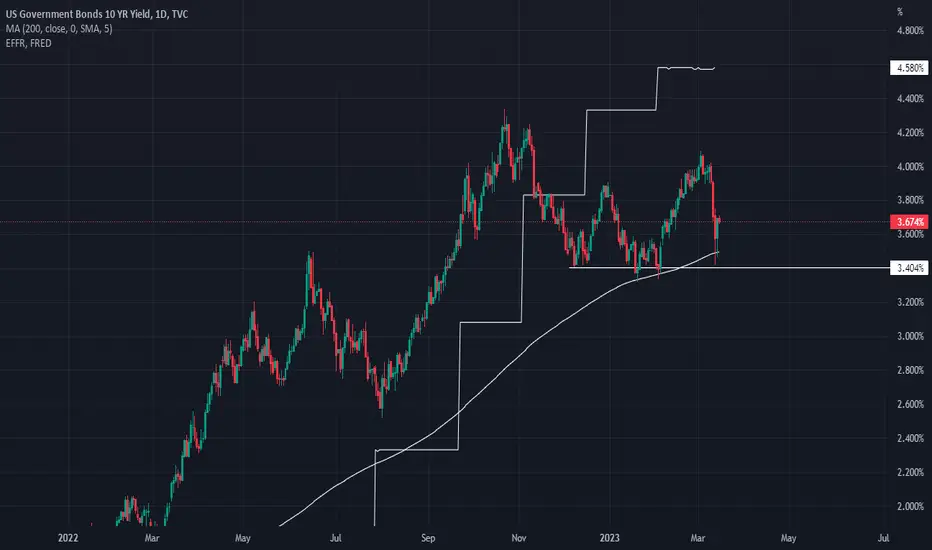
US10Y : Holding the 200MABond yield had been dropping since SVB.
US10Y as well as US02Y fell until both hit the 200MA.
Lets see if it will stay where it is now or fall further.
But I think the next FOMC will decide. And watch out for OIL.
Good luck.
P/S : Do not just believe what I say. Use your common sense.
Super inversionYield curve has been very inverted for the last couple of months. This is the strongest signal for a recession compared to the fake out that happened in 2022. Strap on to your trousers there is more bear market to come most likely for pretty much everything.
Short big run ups and stocks that are highly overvalued and there will be a continued correction for many names.

ten year yield plummetsToday the 10YY has proven that the last breakout turned out to be false as Treasuries are being bought hard. I think this is a fear move because of banking issues. Usually a lower interest rate / yield would be positive for stocks but not necessarily in the face of other bad events happening.

YIELD CURVE HAS LIKELY BOTTOMED--RATE HIKES WILL ENDthe #yieldcurve 10y2y. The Weekly Chart has a picture perfect hammer candle striking EXACTLY at the 1.0 Fibonacci Extension at -1.081%. This fibonacci bounce, coupled with the banking crisis, and the huge drop in the 2y yield (BIGGEST DROP IN 2Y SINCE 1987), leads me to believe the curve has bottomed.

US10Y - SVB Smokescreen 😹Who knows maybe its a coincidence 😹 but SVB collapse happened on Friday and on the very same day the first US10Y bearish momentum candle printed pulling down and away from the long term Fibonacci cluster and the Demand Line from the lows.
Friday was the first day the yields bear took over.
The 3rd wave before the collapse grinded up the Demand Line and then printed a mini blow off top shakeout reversal pattern.
FWIW we shorted TBT to take advantage of the decay as the day MACD lines crossed on Wednesday.
But anyhow the take home point is that the news have scared everyone away now.
Everyone now knows its a terrible time to buy, especially anything classed as "risk on."
Meanwhile the crypto bull market has been going 2 months.
And the stock bull market is about to begin.
Its the same game at every bottom - works every time 😹.
Not advice.

US 10 Year Treasury The bond traders are the most accomplished on he street.
This chart shows the blow off from news.
It is important that we understand the if rate sink more this will but a huge pressure on all stock and upward push on gold.
Please look at this chart and understand that a interest move much lower could cause a huge reaction
