US10Y trade ideas

The 10 - 2 spread suddenly contracted by 20%This finally might be the beginning if the re inversion of the yield curve. When it crosses above 0% prepare for something unexpected to start the sell off. Might be a chain event from all these banking issues. This is the calm before the storm.

US10Y - Strong support around 3.60%US10Y - Strong support around 3.60% (green line - uptrend from 2020).
Multi-decade red downtrend line, already broken.

US10Y long view, target zone 3,0%-3,25%This example shows how the US10Y has been moving in a bullish trend since the beginning of 2020 (at 0.345%). From the bottom, we have a trend line as support, after which the first higher high was formed at 1.75% (resistance zone). Then follows a pullback to the lower support line and a new bullish consolidation up to the previous resistance zone. In January, we see a break above the resistance zone, and that zone now represents a support zone for us to continue the bullish trend. US10Y makes a new higher high to confirm the continuation of the bullish trend, then we retest the support zone, and a bullish impulse follows. Now our target is 3.0% psychological level and after that the previous high at 3.25% level.

Treasuries are in flat till autumn5 wave structure between Aug 2021 and Oct 2022 seems complete since the interment broke though the trend channel. Most likely the it will be forming a sideways correction flat of triangle. I see two possibilities:
scenario #1: it goes up to 4.3% and then fall towards 3.3% or
scenario #2: it goes down to 3% and then go up to 4.3% and down again to 3% level
if 4.3% gets reached first then it is opportunity to sell USD, alternatively (if 3% gets reached first) then it is a chance to buy USD.

Us 10 year yield is dropping warn signDue to big movement into markets today and banks getting sold out... we are getting into a neutral position on rates.... IF rates drop bellow 3,5% we are probably going into a recession... without way back for my perspective! No add position... total neutral now

US10Y Bearish short termThe US10Y reached the top of its Channel Up and is reversing on a Head and Shoulders formation.
Top made very close to the 0.786 Fibonacci.
Trading Plan:
1. Sell on the current market price.
Targets:
1. 3.575 (MA200 (1d) and Fibonacci 0.236).
Tips:
1. The RSI (1d) is on a Rising Support. An additional indication of when to take profit.
Please like, follow and comment!!

10 YEAR TREASURY: POTENTIAL SETUP FOR A CRASH?The 10 Year Treasury is showing signs of weakness flashing on a 3 Week timeframe
Following our recent run to 4%, this may have been a dead cat bounce before resuming a clear downtrend
In addition, the 3 Week MACD has printed a red candle, which is the first since December of 2018 (when looking at candles flip from green to white to red)
Ironically, December of 2018 was when the Fed U Turn happened after the last hiking cycle...
If CPI comes in under expectations (which, according to Truflation, is very likely as we currently hold at 4.78%.)
Expect Yields & $DXY to drop like a stone, & the start of the next bull cycle
Nothing will stop what is transpiring in the charts, there is no 2nd wave of inflation, no debt crisis... if there was, the markets would crash, but you cannot fight the trend

US10Y - US02Y predictor for major recessionsMarket risks are increasing day by day and the following inversion ( US10Y - US02Y ) might hit markets severely leading to a massive correction.
BlackRock 2023 Global Investment Outlook is in line with the warning and they are of the opinion that we are facing recession, stubborn inflation , and a new era that won't be so kind to investors.

US BOND 10YR YIELD Chart Fibonacci Analysis 030723 1) Find a FIBO Slingshot
2) Check FIBO 61.80% level
3) Entry Point > 3.95%/61.80%

Inverse Relationship between US10Y & Market Indices DJI SPX NDQInverse Relationship between US10Y & Market Indices DJI SPX NDQ
Above certain levels US10Y negatively effects market indices & commodity prices.

🔥 Bond Yield Curve Inversion Reaching -1%: Why It's ImportantAn inverted yield curve occurs when the yield on a 10-year Treasury bond falls below that of a 2-year Treasury bond. Normally, longer-term bonds have higher yields than shorter-term bonds. This is because investors demand a higher return for tying up their money for a longer period of time.
However, when short-term interest rates rise above long-term interest rates, it can indicate that investors believe the economy will weaken in the future. This is because investors are willing to accept lower yields on long-term bonds if they believe that interest rates will fall in the future as a result of weak economic growth. Essentially, they are willing to lock in a lower yield now, in the hopes that it will be higher in the future.
An inverted yield curve can lead to a number of problems. For example, it can make it more difficult for banks to make money. This is because banks borrow at short-term rates and lend at long-term rates. When the yield curve is inverted, the interest rates that banks earn on loans are lower than the interest rates they pay on deposits. This can squeeze bank profits and make them less willing to lend. And we all know, less money in the market means less potential (risky) investments.
An inverted yield curve can also be a sign of a potential recession. Historically, an inverted yield curve has preceded every recession in the United States since WW2. This is because an inverted yield curve can indicate that investors are pessimistic about the future of the economy. They may be selling off stocks and other assets, which can lead to a downturn in the stock market and a decline in consumer confidence.
In conclusion, an extremely inverted yield curve like now is a situation in which short-term interest rates on government bonds are higher than long-term interest rates. This can indicate potential economic problems, including a recession and difficulties for banks. While an inverted yield curve is not a guarantee of a recession, the probability of the current yield inversion suggesting a coming recession is very high.
It's going to be an interesting year.

US10Y Double rejection. Targeting the 1D MA200.The U.S. Government Bonds 10YR Yield (US10Y) has been trading within a Channel Down pattern ever since the October 21 2022 High and even though there might be a Diverging Channel Up (dashed lines) emerging, the current level makes a strong Resistance cluster.
With the 1D RSI also rejected twice on its Higher Highs trend-line, we are turning bearish on the US10Y again, targeting the 1D MA200 (orange trend-line), which supported the price twice on January 19 and February 02. Potential contact (as a target) can be made at 3.550%. We will continue to be bearish only if the 3.320% Support breaks.
-------------------------------------------------------------------------------
** Please LIKE 👍, FOLLOW ✅, SHARE 🙌 and COMMENT ✍ if you enjoy this idea! Also share your ideas and charts in the comments section below! **
-------------------------------------------------------------------------------
💸💸💸💸💸💸
👇 👇 👇 👇 👇 👇

United States 10-Year Bond Yield - AT RESISTANCE 🤨👎Massive level of resistance has played out and Stocks could power higher as Treasury yields and dollar might ease further.
4,22% has been a Major Support/Resistance level (S/R as you can see on the chart) and the prices down have dropped even lower, below the psychological 4%
What does that mean?
When US government bond yields are on resistance, meaning they have reached a point where they are likely to reverse direction, it can have a significant impact on various aspects of the economy and financial markets.
One of the most immediate effects could be on the stock market. Higher bond yields could lead to a sell-off in equities as investors may shift their money from riskier assets to safer ones like bonds. This could result in a temporary decline in the stock market and a potential increase in market volatility.
The impact on the broader economy is more nuanced. Higher bond yields can lead to higher borrowing costs for businesses and consumers, which can slow down economic growth. However, if the bond yields are rising due to a strong economic outlook, it could be a sign of healthy economic expansion, which could offset the negative impact of higher borrowing costs.
The Federal Reserve's monetary policy could also be affected by rising bond yields. If the Fed believes that rising bond yields could lead to an economic slowdown, it may adjust its policy by lowering interest rates or increasing its asset purchases to keep borrowing costs low and support economic growth.
In summary, when US government bond yields are on resistance, it could have a significant impact on various aspects of the economy and financial markets. It could result in a temporary decline in the stock market, higher borrowing costs for businesses and consumers, and potential adjustments to the Federal Reserve's monetary policy.
What's next?
🆘 The Feds are lots of data to watch out for:
📌 Fed Chair Powell speaks on Tuesday/Wednesday
📌 JOLTs job data on Wednesday
📌 Fed Beige Book on Wednesday
📌 Fed’s Barr speaks on Thursday
📌 February jobs report on Friday
📌 Final week of Q4 earnings
Hopefully, this is a good sign to see a further rebound in the markets and a more dovish Federal Reserve.. unless they are aiming for chaos in which case they intend to raise rates over the 6%
One Love,
The FXPROFESSOR

Big Four: 2023 Macro ConclusionsI begin each year with a macro assessment of what I refer to as the big four markets: Bonds, Equities, Commodities, and the Dollar index. Over the last six weeks we have examined monthly and weekly charts of the big four, and developed our thoughts around how the next year might unfold. Those more detailed pieces are linked below.
Late last year we presented a tutorial on using momentum to visualize the business' cycle from a market perspective (series linked below). We also produced a series covering credit conditions (also linked below).
In this piece, we will combine all the things in an attempt to develop our trading views for the year.
Bond Monthly: While there is still more work to be done to confirm the trend change, I believe the bond trend is finally changing as the world moves from the low inflation backdrop of the last several decades to a more inflationary backdrop. I intend to be a better seller into rallies and bearish technical setups in the weekly/intermediate perspective.
S&P Monthly (Log): In the absence of overtly bearish behaviors and with the primary trendlines intact, I would be hard pressed to conclude that the macro trend has changed. In short, the secular bull remains intact and it should be given at least some of the benefit of the doubt. But my suspicion is that the secular trend is changing and that a primary bear market is unfolding. While still willing to take bullish trades in the daily and weekly perspectives, I am much more interested in opportunities to sell solid technical setups into weekly perspective strength.
Commodities Monthly: I am a better seller of strength and will prioritize bearish setups. This chart continues to support the idea that the business cycle is weakening/topping.
Dollar Index Monthly: The 70.70 - 121.02 trading range has defined the Dollar trade over most of the last 4 decades. Even at the August 2022 high, DXY remained well within this range. Since correcting from the August 2022 high, the market is now in the upper center of this range. Moves inside the bounds of the range are primarily noise and while they present trading opportunities, they mean little in macro terms. If the market does test the top of the broader range, my expectation is that a major shorting opportunity will develop.
Business Cycle Matrix: The matrix is entirely consistent with a weakening business cycle that has yet to trough. Over the last two years rising short and long rates led the cycle lower. Equities, responding to higher rates, turned lower this year and both industrial and agricultural commodities are now weakening as economic demand wanes. The outlier is the Dollar. It has benefited from global flight to quality, carry and the aggressiveness of our central bank verses other central banks. But, of the asset classes, the Dollars relationship to the business cycle is the least consistent.
Rates clearly led this cycle lower and it is likely that they will lead the next cycle higher. It is important to note that short rates have risen more than long rates. This has created the type of highly reliable yield curve inversion that signals a coming recession.
High Yield Option Adjusted Spread - Investment Grade Option Adjusted Spread Monthly: If there is any one thing, other than a collapse in inflation, that would induce a Fed pivot it would be a rapid deterioration in credit conditions. A collapse would show up in this chart (series linked below). A spread moving back into the 500-600 bps area would get the Feds attention and begin to set the stage for a rapid pivot.
Conclusions:
1. The business cycle is likely to weaken over the coming months.
2. The weaker cycle should produce lower equities (earnings will finally begin to deteriorate).
3. A recession should put in a temporary top for bond and note yields.
4. A sharply steeper curve, led by short rates falling more rapidly than long rates, would suggest that the recession was here.
5. A weaker business cycle should produce lower commodities and a lower Dollar.
For myself, I like to have a blueprint of expectations to trade and position around. But it is also important to be flexible. In highly financialized and interlocked economies things change quickly and plans must be adapted to the new situation. I suspect that risk management and flexibility will be needed this year.
Many of the topics and techniques discussed in this post are part of the CMT Associations Chartered Market Technician’s curriculum.
Good Trading:
Stewart Taylor, CMT
Chartered Market Technician
Shared content and posted charts are intended to be used for informational and educational purposes only. The CMT Association does not offer, and this information shall not be understood or construed as, financial advice or investment recommendations. The information provided is not a substitute for advice from an investment professional. The CMT Association does not accept liability for any financial loss or damage our audience may incur.

My Thoughts on Treasury Yields and Why You Should Care5% of on a 1-year US Government Bond Yield?
I never thought that I would see the day.
Many of us have grown up in a low rate world. Today, you buy a US Treasury bond, hold it for a year, and get 5%. That's more than most stocks yield in dividends, probably nearly double or triple the average. However, it's said that the S&P 500 averages 7% a year or so. Nonetheless, factor in recession fears and the trade becomes even more interesting.
What are government bond yields?
A government bond is a debt security issued by a government to raise money. When you buy a government bond, you're effectively lending money to the government in exchange for interest payments. The yield on a government bond is the return you'll receive on your investment, expressed as a percentage. So if a bond has a face value of $1,000 and a yield of 3%, you'll receive $30 per year in interest.
Why are government bond yields rising?
I can list out those reasons for you below:
1. Inflation
2. The Fed is purchasing less Treasuries
3. Economic growth is slowing, which means taxes will be less
What are the major implications?
Opportunity costs.
I'll say it again: Opportunity costs.
Everything that is bought, sold, and/or traded now must be weighed against this 5% yield. Do you want to buy Apple for the next year at its current valuation or take a risk to get 5% on a Treasury bond? You can substitute Apple for anything and everything that comes to mind from construction investments to crypto.
Do I own any bonds?
NO. I missed it and am only now paying attention. Will I potentially add some to my portfolio? 5%? It's possible. That's why I wrote this idea. I want to share my thoughts and add a few of these symbols to my watchlist.
I look forward to reading your comments!

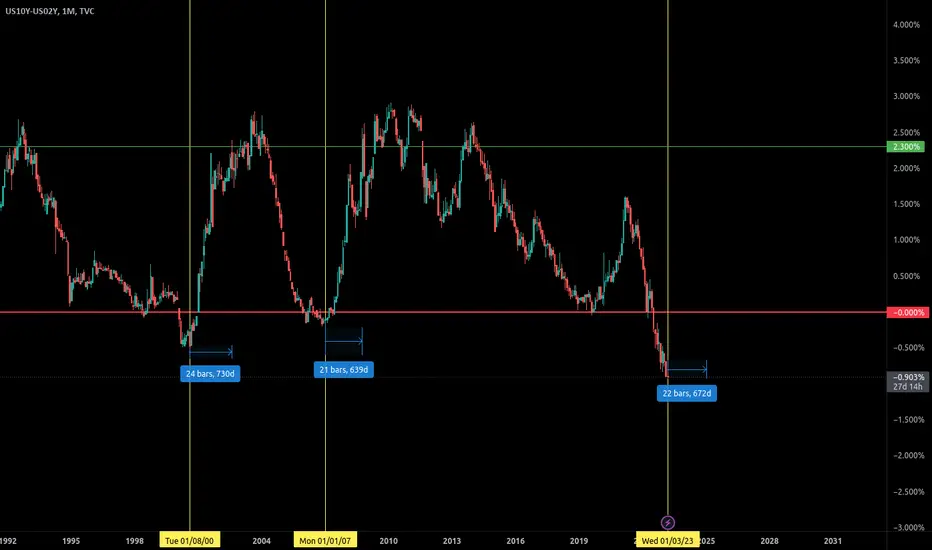
The yield curve scares meThis could be a disaster. The crashes in the past started when the 2y and 10y yields re invert from negative to positive territory. I checked when the bottoms of the indexes came in the past and it was when they re inverted to 2.3%. We are far far away from the bottom if history repeats. This is the only thing that worries me when it comes to crypto. Crypto is no longer isolated from the stock market.

Interest rates - Bond yields... Are they really going higher?Recently the market's expectation for the Fed Funds Rate peaking around 5% and then coming down at the end of Q4 2023 changed, with the market now seeing rates going to 5.5%. Many investors/analysts are discussing bond yields heading to 6% and staying higher for longer. However, is that going to happen? What is sentiment telling us right now? What is data indicating? If rates keep going up, what does this mean for other risk assets?
Sentiment right now seems to be quite bullish on yields (bearish on bonds). We are probably near a short-term top for bond yields, and I think this Fed hike may be the last one. The reason is that in Q3-Q4, we started seeing an actual economic deceleration, and inflation dropped significantly. In January, we had some weird data that might have to do with seasonality and adjustments on how inflation is calculated. The critical thing to note here is that rising interest rates act with long and variable lags and that the drop in inflation since July 2022 was caused by factors irrelevant to interest rate hikes.
So let's take things from the beginning... Since Covid hit, we have seen tectonic shifts in markets. Many things changed in the global economy, which was already in bad shape. It's unlikely that inflation will be contained for a long time, given that we are at the end of the debt cycle, the end of globalization, we are in a war cycle, we are at war against the climate, and the labor market is changing rapidly. Therefore, bonds will likely substantially underperform inflation in the next decade. In 2020 and 2021, fiscal policy was heavily used over monetary policy, and we still feel the effects of those policies and the aftereffects of Covid.
US monetary policy started shifting in March 2022, when the Fed began hiking rates and Quantitative tightening in July. Hence the changes in monetary policy couldn't have affected markets, as it takes more than 12 months for changes like this to have any effect. Of course, we also had the Russian invasion, which caused a commodity spike, and we had Europe and the US spending a lot on Ukraine and war equipment broadly. Then the relationship between US and China started worsening, while China was under lockdown and only started reopening in December - January.
The global economy is in terrible shape and will get into a steep recession eventually. Some data make it look strong at times, but it isn't. I think the Fed is looking and acting in the worst possible way, and it's trapped. At the moment, markets are afloat mainly because of human ingenuity, past fiscal and monetary stimulus, and the actions of Central banks like the BoJ, HKMA, and PBoC, as well as the BoE and ECB having some form of QE going on, while the Fed & US treasury is increasing market liquidity by draining the TGA, creating T-bills and bank reserves. It's unclear what will happen when all the interest rate hikes start affecting the economy, but Central banks and Governments will resume supporting markets and the economy. There are several tricks they can implement before they start cutting rates or continuing QE, or doing Yield Curve Control, but ultimately they will get to that point.
Now finally, let's get to the charts!
TLT / UB look like they are bottoming here. Swept the lows but closed slightly above them. Double top and significant gaps are higher, so that's where I think it's headed. I don't want to say that we will go massively lower, but for now, I treat this as a range, and I don't want to let my view that inflation will come down affect me. My target is the range highs and nothing more.
SHY looks like it capitulated and filled a double gap (partially) to the downside. That double gap occurred near the bottom, but now we have a massive double gap open to the upside, telling me it could go higher. Both that and TLT tell me yields down (bonds up)!
Short-term yields have been increasing, with US 2y getting near 5%. Maybe that's the psychological level everyone thinks will break easily, but it doesn't. The majority is eyeing 6%. Perhaps we do a slight break above 5% on the 2y, then fall quickly below it. The average bond yield (random average) is at 4.5%, it also made a new high, but this could be a trap. I am not seeing much strength here. The 10y, which I used as the base chart for today, reaches a critical level where the major correction to the downside began and has found some resistance there.
Finally, I wanted to discuss a few currencies and some overall observations. EURUSD and GBP are at support but looking weak. I can see how they could have one last dip and then higher, but I don't want to see them go much lower from here.
USDJPY and USDCNH are trading higher, with USDJPY being 10% lower from where it peaked. The interest rate differential was the same as now or lower, so something is happening here. Maybe rates are peaking? Maybe the interventions from CBs and Govs are working? Stocks are also much higher than back then, and they don't look like they will go down. Both pairs seem to be back in an uptrend which seems close to peaking. Based on how their charts look, I don't think the USD will keep strengthening, which is telling me that something big has shifted in markets, which is bullish risk assets, and potentially bearish on bonds yields.

Higher Yields May Cause Bigger Correction On DXYHigher yields may cause a bigger correction on DXY, as yields can be still looking for wave 5 by Elliott wave theory.
Yields higher, USD strong, stocks down. Risk-off flows may not be over just yet if yields are in fifth wave. However, when yields will make new high and then top after 5th, thats when DXY can complete B/2 rally, with a lower high, when focus will shift away from US to other CB. However, of course, wave 4 on yields can get more complex if current trendline support is broken, so wave B/2 on DXY may take more time to unfold.
Grega

Yield Curve InversionThe chart above is a yearly chart of the ratio of the 10-year Treasury yield (US10Y) to the 2-year Treasury yield (US02Y). The chart is meant to highlight how extreme the yield curve inversion is getting. Typically a yield curve inversion is indicative of an impending recession.
Usually, the 10-year treasury should have a higher yield than the 2-year treasury since there is more risk involved when you invest in a longer-term treasury. Just recently, the 10-year treasury yield has reached a record low ratio of only about 85% of the 2-year treasury yield. In other words, investors are being compensated less for taking more risk.
As the chart below shows, the rate of change (on a quarterly basis) in the 2-year Treasury yield has been parabolic.
Below is the rate of change (on a quarterly basis) in the 10-year treasury which is typically more stable than the rate of change seen in shorter-term treasuries. The chart shows that the 10-year treasury yields have also been moving up at an unprecedented quarterly rate of change.
Many analysts look to an inversion of the 10-year yield with the 3-month yield, which has not yet occurred. The failure of the 10-year yield to invert relative to the 3-month yield is likely due to the unprecedented rate of change in the 10-year yield, which has historically remained relatively stable. If the 10-year yield is moving up at a higher rate of change than the 3-month yield, this can delay or prevent an inversion altogether.
Check out my analysis from July for a more in-depth discussion on why the failure (or delay) of the 10-year yield to invert to the 3-month yield might be signaling that we've entered into a new supercycle, in which higher yields may continue for the long term:

Us rates back trens upDue to inflationary pressure rates in the usa is getting stronger now.. so its trend up. Bad for stocks

US10Y Rejection cluster. Targeting the 1D MA200 again.The U.S. Government Bonds 10YR Yield (US10Y) has been trading within a Channel Down pattern ever since the October 21 2022 High and even though there might be a Diverging Channel Up (dashed lines) emerging, the current levels and the fact that it has failed to break higher in the last five 1D candles, make it a strong Resistance cluster.
With the 1D RSI also on such a rejection junction, we are turning bearish on the US10Y again, targeting the 1D MA200 (orange trend-line), which supported the price twice on January 19 and February 02. Potential contact (as a target) can be made at 3.510%. We will continue to be bearish only if the 3.320% Support breaks.
-------------------------------------------------------------------------------
** Please LIKE 👍, FOLLOW ✅, SHARE 🙌 and COMMENT ✍ if you enjoy this idea! Also share your ideas and charts in the comments section below! **
-------------------------------------------------------------------------------
💸💸💸💸💸💸
👇 👇 👇 👇 👇 👇
