YIELD CURVE FORECASTING TOOLWhen the yield curve has inverted for a quarter, that means longer term interest rates on average are lower than shorter term interest rates. This predicts that a recession will follow.
- Campbell Harvey, Finance Professor at Duke University
US30Y trade ideas

Yield Curve vs S&P PerformanceWhats Up Guys,
Have been listening to a lot of chatter about the Yield Curve, so I wanted to plot it out for myself and do a little homework.
Put some things into perspective for me. Have a look - let me know your thoughts

The preponderance of evidence: US 30-yr bond yieldsThis is part of a series of charts which I will posting for the reader to make up his/her mind based on the weight of the evidence.
Do note, these are weekly charts which means the implications of which will occur over the next 12, 18, 24, 36 months.

$tlt $spy LT trend is still downThis is how I see it playing out. We are at or near peak business cycle

US 30 YR YIELDHello everyone. Here is a trade idea on the 30 year Treasury yield. According to the weekly chart, there is a breakout of the inverted heads and shoulders of the 30 year yield.
Macro Thesis: The FED controls the short term interest rate, and the long term interest rates are determined by the supply and demand, meaning the buyers and sellers of the long bond. The last thing the FED wants is an inverted yield curve . IF this thesis is correct, the the 30 year bull run of the long bond might be ove r.
According to the chart, the 30 year yield has the potential to reach 4.2% according to the inverted heads and shoulders target. With the 30 year yield up, the 10 year yield will follow, and the FED will raise rates to the neutral target of above 3%. The trade has a reward to risk of 3.6, if the stop is placed near the right shoulder.
GOOD LUCK

us 30 government bond#Us30 goverment bond might be looking bullish in the next coming weeks
price broken up 2 patterns on the charts
if u entere the market without any reason you will be slapped like crazy..so to go long find a correction that will signal us for a bullish move
im not giving any signal or so on this is an overview of what j see..good luck


Rising rates: Why is the 30 year yield so low? The 30 year treasury yield has traded under 3.25% for almost 4 years now.
The Fed continues to hike rates on a quarterly basis and Trump is unhappy about rising rates.
Every day we hear how the economy is 'in great shape', and jobs data is 'as good as it gets'.
More significantly what is pushing up rates are increased treasury issuance and the Fed's accelerating Quantitative Tightening.
So all in all why isn't the 30 year yield closer to 4% like it was only four years ago?
For several years the market has priced in low expectations for the long term.
The yield curve continues to flatten towards the lowest spreads since leading up to the great recession.
(28 basis points on the 30-5 spread and 30 points on the 10-2 spread).
At this rate the curve could flatten or invert in 6 to 12 months.
An inverted yield curve historically is followed by economic recession.
What's your thoughts?

US10Y FOR 3.000 US30Y FOR 3.200Rate hike 93% probability in week ahead. Expect to see the 10Y at 3 and 30Y at 3.2 over the next 10 trading days.

starting of study the correlationall mentors feel free any suggestion for the correlation
thank you and God bless

Make a quick buck every day w this quick scalp. Free money.Set bracket orders. profit.
GG.
Every day. Enjoy you 300$ daily.
* I need to start doing this.

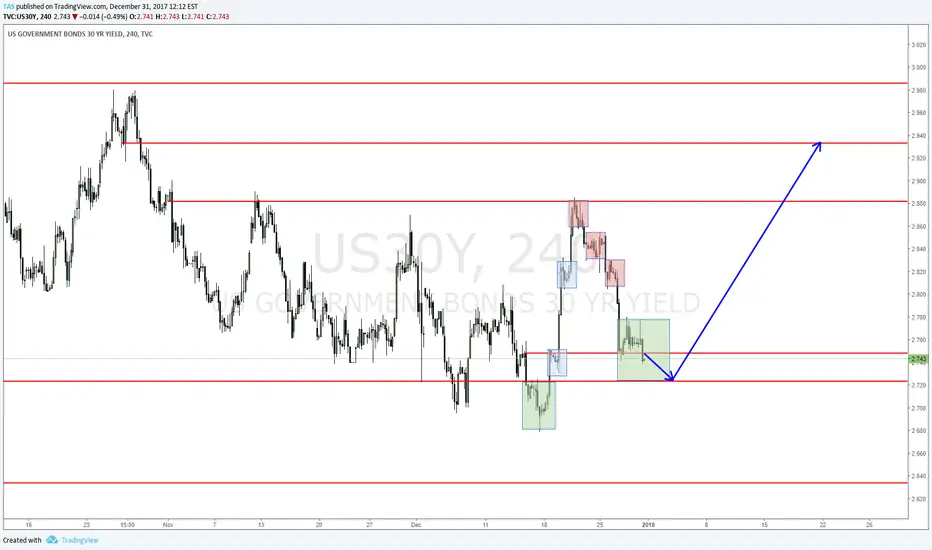
Long US30Y, daily breakout
daily chart broke above 3.226
target could be 3.288 or greater
stop below 3.2

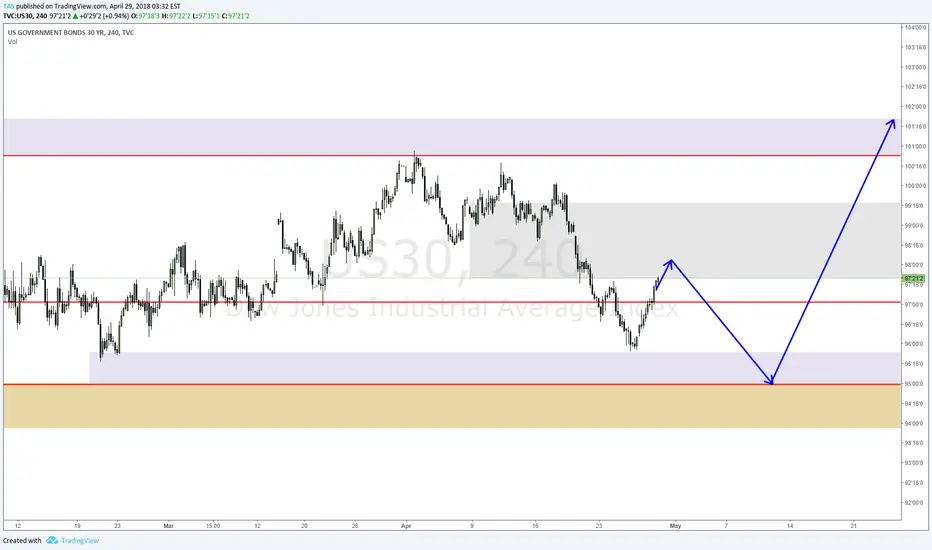
US 30Reason I would've placed this trade was because I saw a supply zone at 98"05"7 level. this zone has never been tested before which means this is a fresh zone, worn out zones cause exhaustion in price. I have a 1:4 risk vs reward, risking 30% to make 1.30%.

US30 moving sideways still, long seems more profitableUS30 moving sideways still, long seems more profitable
US Treasury 5s30s and 10s30s Curve - Flat Curve Predictions?The current trajectory of the flattening in the US Treasury 5s30s curve (30y yield minus 5y yield) and the 10s30s curve (30y yield minus 10y yield) illustrates a potential for the following:
1) A flat curve by July 2018 if the flattening trajectory continues (green lines);
2)A flat curve by Nov 2018 if we plot the trajectory from the recent steepening of the curve (red lines).

Flat Yield Curve Equals...Are we headed for a flat Yield Curve? The Yield Curve highlights the spread between short term and long term bonds and is an important indicator of economic growth. We are currently in an uptrend, with short interest rates lower than longer maturities. A flat yield curve can signal an adjustment in the economy and a shift in growth. It precedes an inverted yield/recession. Is this a warning sign? Trading Forex / CFDs is High Risk.

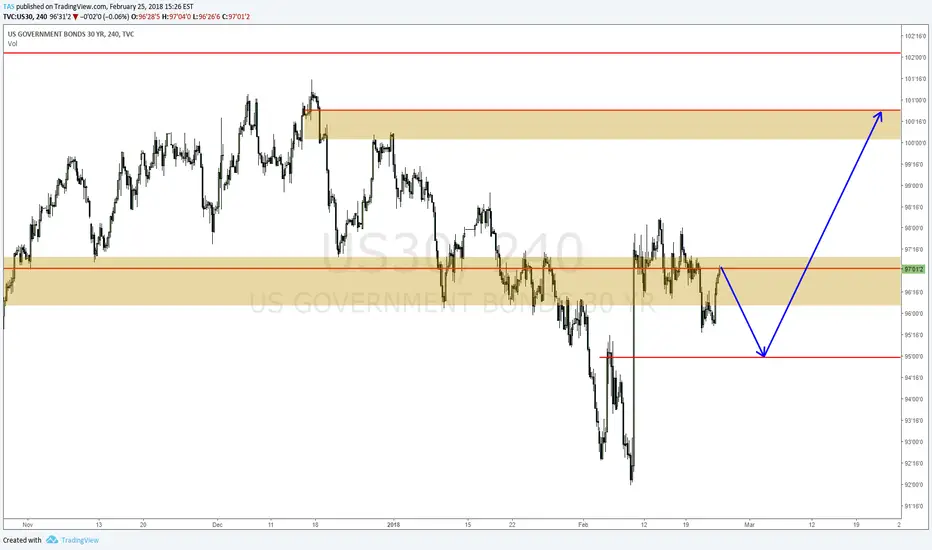
US30Y still in consolidation formating a H&S preparing down moveUS30Y still in consolidation formating a double H&S preparing down move


US30Y | D | GANN GEOTesting this gann |geo| setup. Price quickly moved out the first half intersect. Now testing down resistance.
Cheers,
Keops

