30Y ResistancePullback soon as we test underside of channel. Yellow = Gold Performance. $GLD $TLT $SPY $GDX
US30Y trade ideas


FOMC Minutes Reveal Inflation Still a ConcernThe FOMC minutes are being released as I write this, but weak inflation seems to one of their key concerns. Expect the yield curve to continue to flatten as this gets priced into the long end. The spread between the US 30 year and Us 2 year has been careening off a cliff lately and given this news, it is safe to expect this trend to continue. The Kovach Chande indicator is solidly bearish, confirming this, and the lower bound of the Kovach Reversals indicator is continuously being pushed.
If you want access to the Kovach Momentum Indicators, Reversals Indicator, or Crypto Specific Indicators, please sign up at quantguy.net!


Yield Curve Below 1%, Racing to the BottomThe yield curve (spread between the 30 year and 2 year spread) just broke below 1%. All indicators suggest this trend to continue. It has been encroaching the lower Bollinger Band of the Kovach Reversals Indicator, with no retracement in sight. A retracement will be confirmed by a green triangle, if an when it happens. The Federal reserve should be very mindful of this in their December meeting.
If you're interested in the Kovach Reversals Indicator and more, sign up for access at quantguy.net!

Yield Curve Continues To FlattenThe yield curve struggles to come up for air as it hurdles toward zero. The slope of the trend is clearly decreasing, indicating that the flattening is accelerating. We've tested the lower bound of the Bollinger Band without a relief rally which is a very bearish sign. Also the Kovach Chande indicator is bearish and appears to be increasingly more so.
If you find this technical analysis useful, check out my indicators at quantguy.net!

Yield Curve Continues to FallAs investors price in lower inflation and increased expectations for a Fed rate hike, the yield curve (between the 30 year bond and the two year note) is continuously making new lows. Typically, the flattening or steepening of the yield curve is led by one end, but in this case, both appear to be contributing equally. This presents a problem for the Fed as raising rates (or more hawkish rhetoric) could hurl the yield curve closer to negative territory.
We can see the spread has been hugging the lower bound of the Kovach Reversals Indicator for some time, which is an extremely bearish sign. Also, the slope of the spread has become increasingly more negative.
If you want access to the Kovach Reversals indicator and more, check out quantguy.net.

30 Year, 2 Year Spread Making New LowsThe spread between the 30 year US treasury bond and the 2 year bill has made new lows as the yield curve in the US continues to flatten. Anticipate a pullback at some point, but the curve will likely continue to flatten as investors price in a rate hike despite dovish comments from Bullard at the Fed.
This pullback will be confirmed by a green triangle on the Kovach Reversal Indicator. If you're interested in using this indicator, check out quantguy.net.

The Yield Curve Flattens and Altcoins RipAs the markets price in the next interest rate hike by the Federal Reserve, we see the spread between the 30 year and 2 year US treasuries continue to flatten. It is probably not coincidence that peaks in the Altcoin Index match up with with relative bottoms (especially recently) in the treasury spread.
Also, although this is somewhat due to the Segwit2x drama this weekend, observe how the Altcoin Index has really skyrocketed over the past couple days. This may indicate some cryptocurrency adoption from 'smart money', though many establishment figureheads have publicly rebuked cryptos.
If you're interested in the Kovach Altcoin Index or the Crypto Spread Indicator, among other tools, please check out quantguy.net

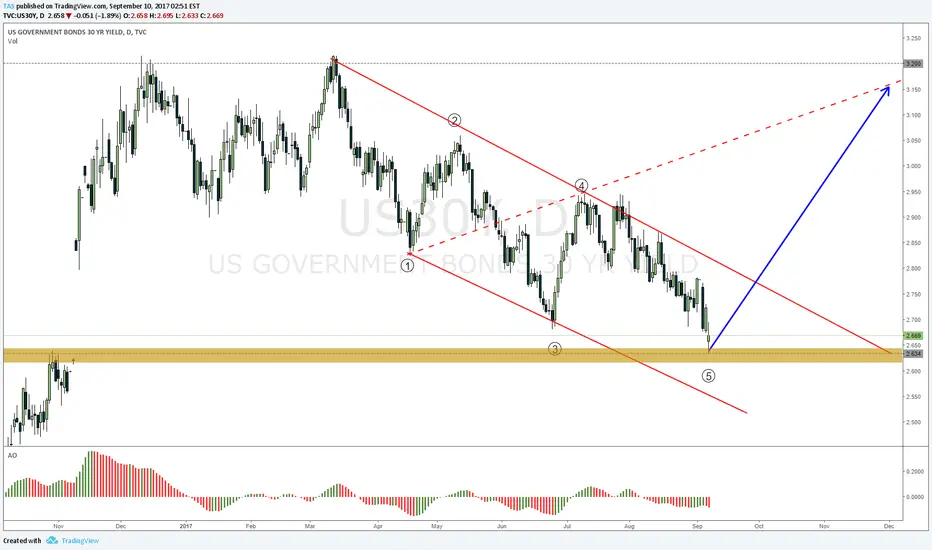
US Treasuries breakoutSeems that US10y and us30y finally left correction channel. With 3 drives pattern the us30y should be back in the 3.25 % in a reasonable time. Check your DX1! , USDJPY, GDX and PM trades....!


Divergent views on US Economy | Yield Curve CompressionLooks like there are fundamentally different outlooks on the economy.


Channel + Pivot-current congestion at old support/resistance, neutral
-below pivot, bearish
-Alternate scenario for bullish: long on both pivot + channel breakout. Watching the 'today support' line for positive test

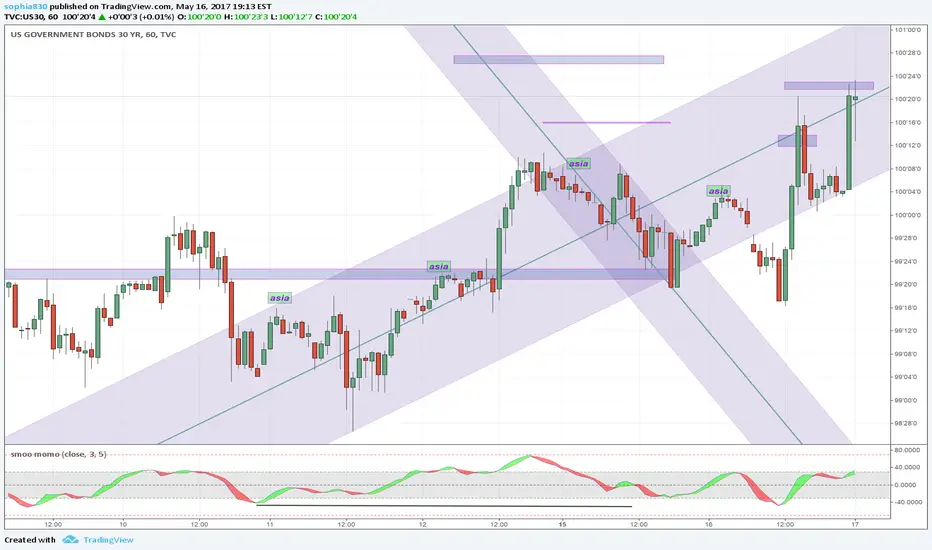
Channel Top? Divergence in Linear Regression-deltas: current 'flight to safety' on political news
-won't short yet, only if price builds under the resistance rectangle (currently price is supported above indicating breakout potential
-real price, not this cfd is now 153^15

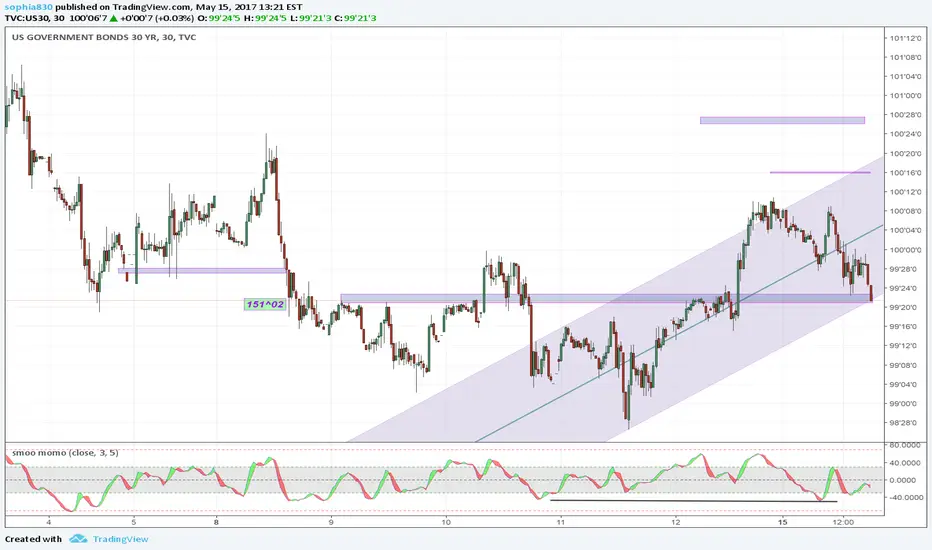
DVG within ChannelDeltas:
-broad market is hitting all time highs.
-this would be a reversal play on that, pullback etc.
Channel and rectangle must hold for trade.
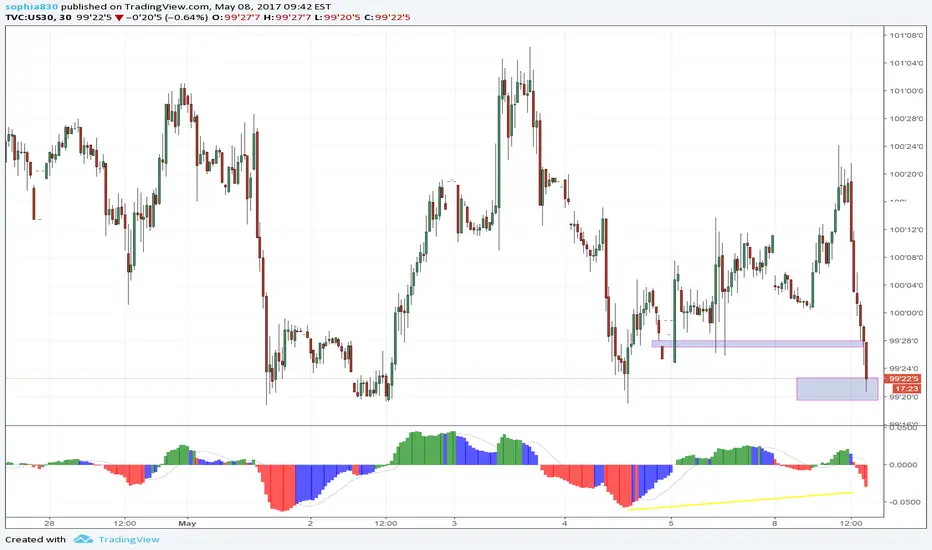
Scalp Long on Level + DivergenceBond:
Scalping long only if over both rectangles and divergence plays out.
Waiting for Regime Continuation or Regime ShiftRisk on or Risk off?
Raoul Pal thinks its time to go long bonds....I like his Macro but let see how institutions are positioned before jumping on the new trend.


long term view on US30Y bondsit will have or should have go down lets see.. i may be wrong on my analysis but there is some thing cocking up here...and if this go down DXY will go down also.
