VIX trade ideas

VIX - forecast 2024The market's recent rally (indices are up 25% since November!) feels frustrating. It doesn't seem to reflect the economic realities we're facing.
Inflation is cooling, but it's still above targets.
The labor market is strong, which might seem good, but it could be unsustainable with high interest rates.
We're seeing layoffs, which contradicts the market's optimism.
Maybe I'm missing something, but the disconnect between the market and the economy is concerning.
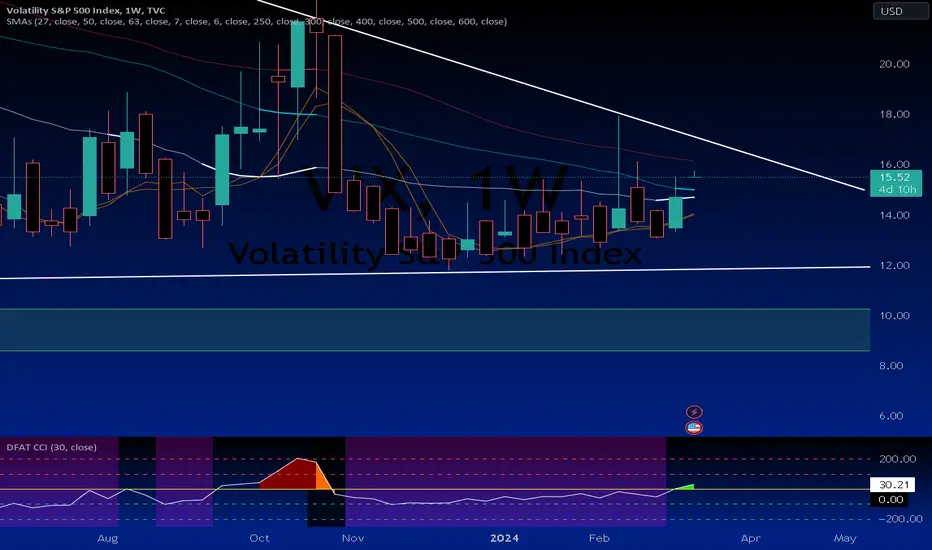
VIX has been rangebound since November 2023 and recently generated a positive MACD signal.
Looking ahead, the FOMC statement and Fed rate decision are later today. Historically, these events haven't triggered major market swings. A significant correction might require unexpected data, particularly a surprising labor market report.
Trade safe!

Understanding The Important VIX!Today I would like to demystify one of the most prominent volatility indexes, the VIX, and explore its significance for traders and investors. Whether you're new to trading or looking to deepen your understanding of market dynamics, the VIX plays a crucial role in assessing market sentiment and managing risk. Let's dive in.
1️⃣ What is the VIX?: The VIX, or Volatility Index, is a measure of market volatility and investor sentiment derived from options prices on the S&P 500 index. It reflects the expected volatility of the stock market over the next 30 days. High VIX values indicate increased market volatility and uncertainty, while low values suggest calm and complacency among investors.
2️⃣ How is the VIX Calculated?: The VIX is calculated using the implied volatility of S&P 500 index options. Specifically, it measures the prices of near-term put and call options on the S&P 500 to estimate expected volatility. The VIX calculation involves complex mathematical formulas and statistical models to derive a single volatility index level.
3️⃣ Why is the VIX Important?: The VIX is important because it provides valuable insights into market sentiment and risk appetite. High VIX levels may indicate fear and uncertainty in the market, leading to increased hedging activity and potential downside risk. Conversely, low VIX levels may signal complacency and bullish sentiment, suggesting a higher risk of market corrections.
4️⃣ How to Interpret the VIX: Traders and investors can interpret VIX levels to gauge market sentiment and assess risk. A VIX level below 20 is considered low and may indicate a relatively calm market environment, while a VIX level above 30 suggests increased volatility and potential market turmoil. Monitoring changes in VIX levels over time can help identify shifts in market sentiment and anticipate market movements.
5️⃣ Incorporating the VIX into Trading Strategies: You can incorporate the VIX into your trading strategies in various ways. For example, some traders use the VIX as a contrarian indicator, buying when the VIX is high and selling when it's low. Others use VIX options or futures to hedge their portfolios against market volatility or to speculate on future volatility levels.
6️⃣ VIX-only Trading Strategies: There are also trading strategies specifically designed to capitalize on VIX movements. For instance, the VIX carry trade involves buying or selling VIX futures contracts based on expectations of future volatility levels. Additionally, some traders use VIX options spreads to profit from changes in volatility levels or market trends.
7️⃣ Practical Tips for Beginners: It's essential to start by familiarizing yourself with the basics of the VIX and how it's calculated. Practice analyzing VIX levels and observing how they correlate with market movements. Experiment with incorporating the VIX into your trading strategies and observe the impact on your performance. Remember to always manage risk appropriately and stay informed about market developments that may influence volatility.
The VIX is a powerful tool for traders and investors to assess market sentiment and manage risk in the financial markets. By understanding the basics of the VIX, interpreting VIX levels, and incorporating them into trading strategies, you can gain valuable insights into market dynamics and enhance your trading performance. Whether you're using the VIX as a contrarian indicator, hedging tool, or trading instrument, mastering its nuances can help you navigate the complexities of the financial markets with confidence.

Legacy market volatility might boost crypto marketVIX is too low and USDT.D is at median value + almost flat for few months.
I expect huge volatility on legacy market. Rising VIX get this chart's value into around 4.
If USDT.D drops in the meantime this will be faster.
Anyhow, I expect crypto market will be more profitable or cause less damage to your wallet in the coming months.
This is just my idea and not trading advice.

VIX BEARS WILL DOMINATE THE MARKET|SHORT
Hello,Friends!
VIX pair is trading in a local downtrend which know by looking at the previous 1W candle which is red. On the 9H timeframe the pair is going up. The pair is overbought because the price is close to the upper band of the BB indicator. So we are looking to sell the pair with the upper BB line acting as resistance. The next target is 12.80 area.
✅LIKE AND COMMENT MY IDEAS✅

VIX seems ready to take offIt seems a regular pattern where TVC:VIX breaks the descending trendline and explodes to the upside.

Vix trending sideways with higher lows2 potential Head and shoulders bottoms seen, a breakout coinciding with a break down in the major indecies will confirm a trend reversal.

Buy UVXY calls UVIX & QQQ PutsBolinger bands on the weekly tighter than fort knox's security. RSI Daily coiled just above 50, Haven't been this over extended on the vix since 2007!!

VIX Rising Support Ahead! Buy!
Hello,Traders!
VIX is falling down to
Retest the long-term
Rising support line below
From where we will be
Expecting a local rebound
Buy!
Like, comment and subscribe to help us grow!
Check out other forecasts below too!

A VIX play for tomorrow with high probability and R:RIn this area the VIX is in a discount zone, with these stock market valuations on the side has more upside potential than downside.
Have a great day! :)

Bullish until $16.50 but expect VIX Suppression ActionsJoin us for a post-Monday market close update on the VIX as it approaches the $16 resistance level. Stay informed with our insights into the VIX and its implications for the broader market!

Low vix. Ready to breakout to upside this year. Not much to trade against here but these are my key levels down here on VIX.

$VIXThis Weekly CCI breakout of the positive momentum line could be huge for a market pullback. Don't take your eyes off of it.
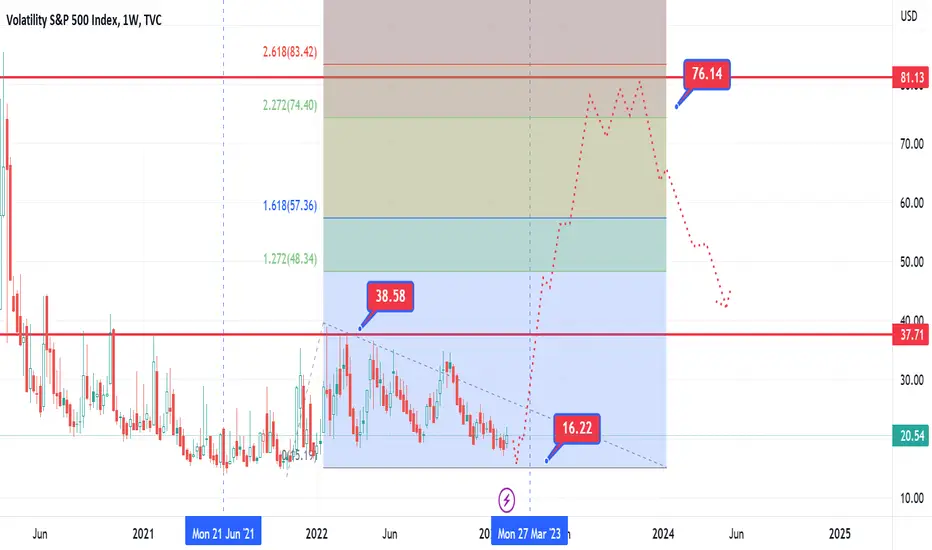
VIX of today vrs 2007 Here were the swings of the VIX in 2007 heading into the crash.
The low was made in Jan of 2007 and the first rally in the VIX went to around 37.
It then pulled all the way back to 15.
Then it went to 80 which was a 220 extension of the pullback.
We currently have a VIX rally off the low to around the same level and have pulled back and are hovering close to the same level the VIX made a low. If we were to have the upswing, this would also be a 220 extension of the pullback to generate a level around the same as the VIX made a high during the crash.
This is a pretty interesting set of matching points. The point in the move this would imply we are would agree with this forecast of a bat move, with us currently being in a spot analogous to the start of the last run into the high of 2007.
vixlooking at the vix on the day as a possible falling wedge that will result in a push to the upside

VIX. Negative DivergenceThe sentiment expected is to be short to protect long positions; according to the negative divergence in Swenlin Volume.

VIX is making higher highs and higher lowsWhile the market continues to rise and investors grow confident the rally won't stop, the VIX keeps subtly making higher highs and higher lows.
Please feel free to express your ideas and thoughts in the comment section.
DISCLAIMER: This analysis is not intended to encourage any buying or selling of any particular securities. Furthermore, it should not be a basis for taking any trade action by an individual investor or any other entity. Therefore, your own due diligence is highly advised before entering a trade.

VIX Risky Long From Rising Support! Buy!
Hello,Traders!
VIX fell down sharply
And is down by almost 20%
From the recent major high
So the index is clearly oversold
Therefore, we will be expecting
A local bullish correction
From the rising support below
Buy!
Like, comment and subscribe to help us grow!
Check out other forecasts below too!

VIX: Possible dump and markets ATH.Looks like VIX is going to dump heavy before the market correction.
This shows markets can go ATH in coming weeks and months. Atleast till Feb 2024.
This is usual pattern in the hiking cycle, markets make ATH during end of hiking cycle and dump during rates cut.
Cheers,
Happy investing.

Looks almost like the chart of since I bought XRP lol.Seriously, be safe out there I plan on rolling over my 401K tomorrow morning.
Things can really shizzz the bed on you.
BE READY FOR ANYTHING PEEPS!!!

VIX SENDS CLEAR BULLISH SIGNALS|LONG
Hello,Friends!
The BB lower band is nearby so VIX is in the oversold territory. Thus, despite the downtrend on the 1W timeframe I think that we will see a bullish reaction from the support line below and a move up towards the target at around 14.49.
✅LIKE AND COMMENT MY IDEAS✅

VIX UPDATEAttention Wolfy Traders: Please be advised that our VIX index is currently decreasing. This indicates that there are brave traders in the market who are not afraid of risk. As a result, the price action in every chart can be fast and volatile. Therefore, it is important to keep this in mind and exercise caution when making trades."
PLAY PRO

Vicky wants 22If you haven't noticed, VIX is heating up.
- Breakout level = 15.31
- Initial Target = 16.40
** If this makes a sustained break above 16.40 then the market is in trouble because VIX will pop to 22 minimum. This will likely occur by Mid-March 2024.
~ If we break 22, upper targets are 25,30, 63.
