$TSM Previous support to turn into resistance?the $108 level was significant support for the TSM for the entirety of 2021. Massive accumulation zone which failed in early March. Interesting level to watch as a failure to reclaim this important level could result in further capitulation in the stock. However if we manage to break above, a false break could be seen as a positive sign for the counter going forward.
2330 trade ideas

<<Weinstein Stage Analysis>>Hey folks! Welcome to my post on Weinstein Stage Analysis on TSM.
Background: Stage Analysis is a topic Stan Weinstein discussed in his book from 1988 “Secrets for Profiting in Bull and Bear Markets“, where he details his classic four stage breakout method for identifying the best quality stocks to buy and sell in any market environment.
Stage 1- The basing:
Stage 1 occurs when a stock bottoms and forms a horizontal consolidation. New shareholders replace the old ones, in turn replacing fear with hope that will eventually turn into greed.
Accumulation tends to speed up near the end of the pattern, triggering a set of higher-than-average volume spikes that show enthusiastic buying interest. On-balance volume (OBV) and other accumulation-distribution tools bottom out with price and turn higher, reflecting the newly bullish technical outlook. Watch closely when these indicators show greater upside than price action within the base, because this can signal an impending breakout that sets off Stage 2.
Stage 2 - The Advance:
Stage 2 occurs when the price has broken out of the consolidation in stage 1. It triggers a bullish uptrend where the price stays above the 30 Week MA. You will also notice that the stock will outperform the S&P 500 during this stage.
Stage 3 - Consolidation:
When the price of the stock crosses below the 30 Week MA, it is safe to assume that stage 3 is happening where the price is in a long consolidation. The price of the stock fails to reach higher highs and the stock tend to underperform the S&P 500.
Stage 4 - Decline:
Stage 4 typically occurs when the price of the stock breaks below a long term support during the stage 3 consolidation. It usually starts with high volume and ends in low volume. Short positions taken early in a downtrend carry higher risk and higher reward than late in the decline.
Conclusion:
Stan Weinstein's stage analysis is a very powerful tool for longer term trading (mainly on the weekly chart) and risk management. Another great example using the Weinstein stage analysis is PYPL where you can clearly see the stock following the stage analysis patterns.


Is Nasdaq about to nuke into oblivion?Taiwan is the world´s largest producer of semiconductors and among them the TSMC reigns supreme with more than a 50% (global) market share.
- extremely clean distribution range
- projected downside is 30% lower
While this is an Asian company and NDAQ is an US index the fact is most of the USA´s blue chip techies get their chips from Taiwan. As a result, a supply crisis in Taiwan should heavily affect the USA and therefore the Nasdaq.

Taiwan Semiconductors are losing favor. TSMImmediate targets 110, 104, 100. Invalidation 158.
We are not in the business of getting every prediction right, no one ever does and that is not the aim of the game. The Fibonacci targets are highlighted in purple with invalidation in red. Fibonacci goals, it is prudent to suggest, are nothing more than mere fractally evident and therefore statistically likely levels that the market will go to. Having said that, the market will always do what it wants and always has a mind of its own. Therefore, none of this is financial advice, so do your own research and rely only on your own analysis. Trading is a true one man sport. Good luck out there and stay safe

Bad news for TSM????Hello Traders,
Today I am covering TSM on a chart analysis...There is no fundamentals on this yet but here goes...Over the last year TSM has been in a consolidation phase which spiked in Jan of this year...Since that spike we are down 28% and have broke a very important support line at the $108ish area to the downside... We are sitting in -MACD with separation from the 9 EMA signal line as well as a bounce off of the 30 RSI overbought levels with a cross of the signal line to test the 50 RSI...What I see materializing IMO is that this retests the support turned resistance line at the $108ish area...If this breaks up then we wait BUT if this breaks down from this point we definitely move in to fill the GAP starting at the $95ish area with a potential move to the downside of 12 to 24% based on price targets...Let me know what you think in the comments below...Happy Trading!!!!!!

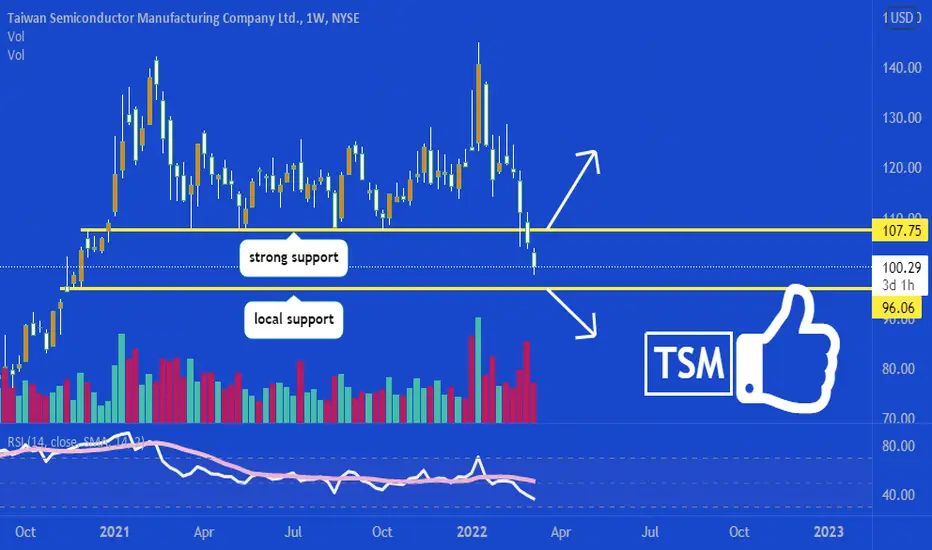
on watch tomorrow! ❤TSM looking to go long is if can break back above what use to be strong support (107.75)
playing downside with puts if it goes below 96.06 local support zone.
like and follow for more! ❤
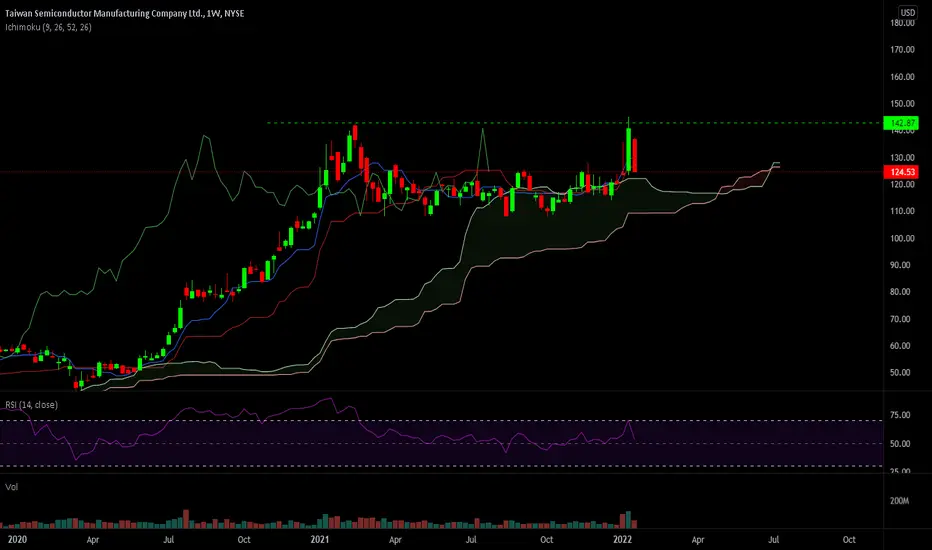
Stan Weinstein 4 stages on $TSM weeklyStan Weinstein 4 stages. on $TSM
- Stage 1 - Accumulation
- Stage 2 - Uptrend
- Stage 3 = Distribution
- Stage 4 - Downtrend - I am waiting !

$TSM 1HR GAP FILL to the upside$TSM 1HR GAP FILL to the upside
What are your thoughts?
Thanks,
Kelly

TSM: Retracement Before Moving LowerTSM - Short Term - We look to Sell at 115.52 (stop at 120.62)
We look to sell rallies. Continued downward momentum from 142.00 resulted in the pair posting net daily losses yesterday. Previous support, now becomes resistance at 116.00. Further downside is expected although we prefer to set shorts at our bespoke resistance levels at 116.00, resulting in improved risk/reward.
Our profit targets will be 104.00 and 101.40
Resistance: 115.00 / 120.00 / 130.00
Support: 105.00 / 100.00 / 95.00
Disclaimer – Saxo Bank Group. Please be reminded – you alone are responsible for your trading – both gains and losses. There is a very high degree of risk involved in trading. The technical analysis, like any and all indicators, strategies, columns, articles and other features accessible on/though this site (including those from Signal Centre) are for informational purposes only and should not be construed as investment advice by you. Such technical analysis are believed to be obtained from sources believed to be reliable, but not warrant their respective completeness or accuracy, or warrant any results from the use of the information. Your use of the technical analysis, as would also your use of any and all mentioned indicators, strategies, columns, articles and all other features, is entirely at your own risk and it is your sole responsibility to evaluate the accuracy, completeness and usefulness (including suitability) of the information. You should assess the risk of any trade with your financial adviser and make your own independent decision(s) regarding any tradable products which may be the subject matter of the technical analysis or any of the said indicators, strategies, columns, articles and all other features.
Please also be reminded that if despite the above, any of the said technical analysis (or any of the said indicators, strategies, columns, articles and other features accessible on/through this site) is found to be advisory or a recommendation; and not merely informational in nature, the same is in any event provided with the intention of being for general circulation and availability only. As such it is not intended to and does not form part of any offer or recommendation directed at you specifically, or have any regard to the investment objectives, financial situation or needs of yourself or any other specific person. Before committing to a trade or investment therefore, please seek advice from a financial or other professional adviser regarding the suitability of the product for you and (where available) read the relevant product offer/description documents, including the risk disclosures. If you do not wish to seek such financial advice, please still exercise your mind and consider carefully whether the product is suitable for you because you alone remain responsible for your trading – both gains and losses.

Looking to buy a bit lowerPrice should be on its way to retest the support! So I will wait to see if it gets there and then will act according to price action ! Too early to buy a great company in my opinion!

TSM
update to my previous analysis
it seems it is still accumulating.
my previous entry was profit & i thought it was going to continue markup
time to look for timing & initiate a new position


TSM about to go thud.Here we have the weekly bars. It clearly shows that TSM has quite a lot of fat on it's bones as evidenced by the 200MA. Normally, I'd give this pattern a pretty good chance at forming a cup and handle, but I think the market is intent on breaking that handle right the hell off. It's reasonable to expect it to retrace down to either the MA or more likely just to the support line around $108. If you chart out the daily bars it'll show you a similar scenario, albeit less clear than the weekly bars.
I think the market in general is selling earnings releases regardless of what they say. This is evidenced by TSM's recent earnings statements which were sold. It reminds me of a "pump and dump" where the stock is ran up with the full intent of unloading it to unsuspecting buyers who think it'll respond favorably to the good earnings release.

maybe a cup and handle this stock builds also maybe a cup and handle formation.
the fundamentals are very strong at the moment.
Buy now allows for a very good profit to loss ratio.
It is over 6.6

TSM has dropped for no logical reasonNYSE:TSM
The price is down 10% for no reason other than fear. There has been no loss of intrinsic value since the peak on the 14th of Jan. Similar to ADBE, CRM, HIMX, ESTC and ARKK, to name a few, the big Friday options expiry has caused panic among retail traders and they have sold their positions. The prices should rebound as fear over the S&P dropping 50% subsides. Personally I wouldn't buy at this moment as the price could fluctuate between the 140-100 mark (risk/reward ratio of 0.9 makes it a fair gamble). However, I would suggest keeping an eye on this stock because intrinsic buyers will most likely buy back into their positions.

$TSM DOUBLE TOP ACTION-We rejected off resistance off $182.47 now we are looking to go lower
-This will run w the rest of the market

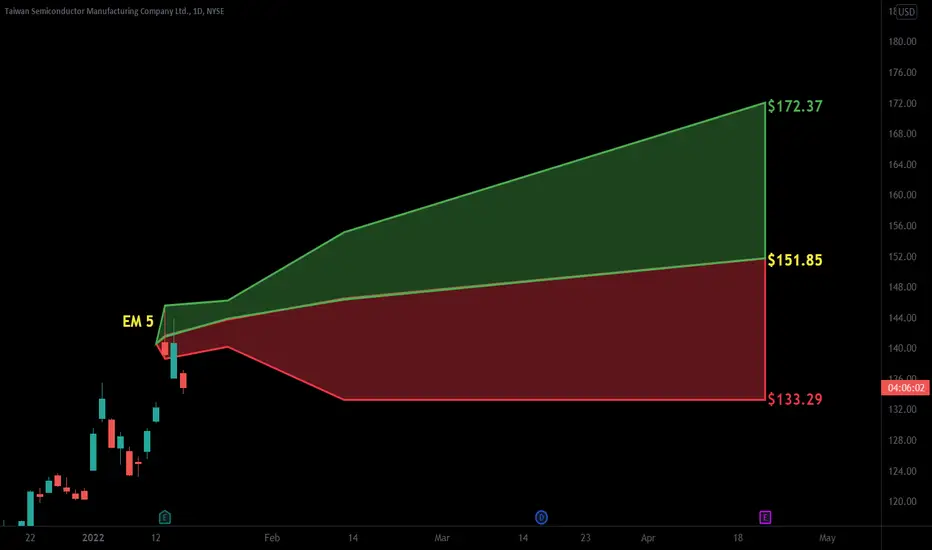
$TSM with a Bullish outlook following its earnings #Stocks The PEAD projected a Bullish outlook for $TSM after a Negative over reaction following its earnings release placing the stock in drift C with an expected accuracy of 50%.
If you would like to see the Drift for another stock please message us. Also click on the Like Button if this was useful and follow us or join us.
$TSM OPTIONS :)-Keeping it very simple playing based off those 2 supply and demand zones
-If we go calls there's not too much room to run
-I'm more on the puts side of this as we notice the bearish pressure on the Daily chart
- WE ALSO HAVE A GAP TO FILL BELOW $136.28

$TSM | WEEKLY WATCHLIST 1/18$TSM 1D
Above $145, we can see continuation to $149-150 to complete wave 3.

TSMC, the cup is formed. Shall we wait for the handle?The OG chipmaker raking in record profits and beating expectations!
Upon the positive result announcement, the price gap up but closed with a slightly disappointing shooting star. Yet, Friday's (14 Jan 22) closing tells us that buyers are still willing to pay a higher price for TSM and the price manages to close at all-time high.
Price technically close above the previous resistance level, but it is not convincing enough. We shall have to prepare for a potential retracement AKA "the Handle" of the recently formed "Cup".
There are two possible ways to play this.
1) The Dollar Cost Average way.
You will use the previous support level, 145, as a focal point. That is to say, your stop loss and risk management will be based on that level. This is because, if the price manages to break below previous support despite good earnings, then there is very little reason to be holding on to this. From a supply/demand perspective, there are overwhelming supplies for the price to move up smoothly. However, as long as the price is above this support level, a higher low can be formed and the price will go higher. But since we do not know where the higher low will be, we will place our position in small batches as the price retrace lower, instead of one big position at the current price. Of course, you should still plan out the maximum limit of your intended position to work out your overall risk. The first batch of your positions could be at the current price to ensure you can still capture something if the price continues to head higher. This option requires holding power as you will most likely be buying to declining and/or sideways price action.
2) Wait for a higher low (the handle) to form first
As the previous support level is too far from the current price, it is better to wait for the higher low to form first. Once a higher low has been formed, you can take the trade with one big position with relatively safe assurance that the higher low will hold. As with option 1), there is no way to know where the higher low will be, thus you will have to depend on price action and candlestick reading to determine this. This option has a higher risk as if you predict the higher low wrongly, it could result in a losing trade. However, the reward is also higher as you will be able to get a precise entry without the need for averaging down.
Option one has more room for error at the cost of requiring better holding power. You might also not have the opportunity to enter the full position as intended as you are slowly spreading them out. This could result in lower profits.
Option two requires more precision and not much room for error. However, it rewards you with a much better entry position without needlessly spreading your seeds.

TSM: everybody wants a piece of TaiwanTaiwan is rich hunting ground for semiconductors manufacturing and with the increasing demand for chips and gpus prices will go higher. No wonder China wants to invade it and make it and its own territory. From a technical standpoint the chart looks great: hitting new ATHs with high volume. I expect it to go a lot higher.
