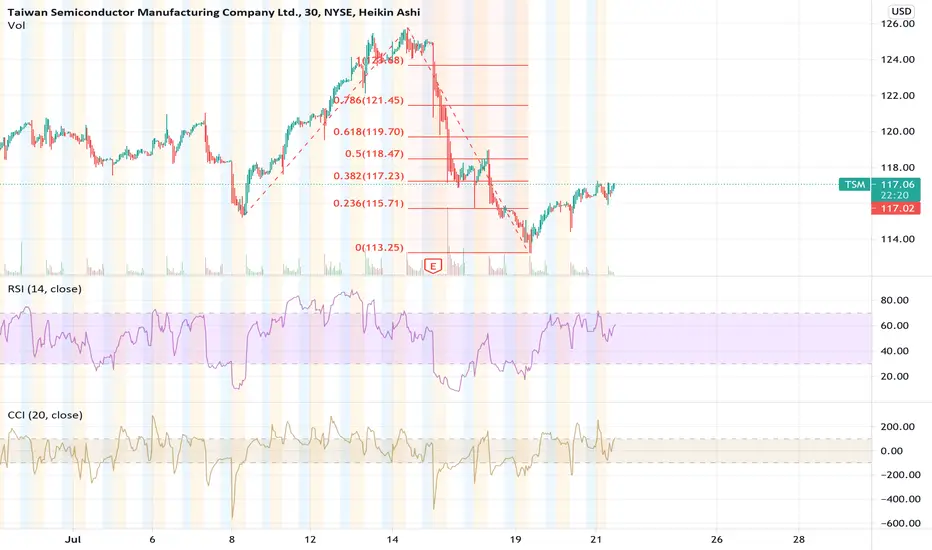
TSM Breakout + Gap fillTSM has been consolidating under the 119 level (rejected 3 times). If daily closes above 119, potential break out and gap fill above to 121 then 124
Technicals:
- RSI over 50
-Price in uptrend
-Ascending triangle pattern
-9EMA crossed 21EMA (daily time frame)
-Decreasing volume inside triangle pattern
-Gap above (121 to 124)
-Price at volume shelf
2330 trade ideas

$TSM monthly$TSM monthly chart is trading in a range. By watching price action within this range can give us some insight about how $TSM will likely act in the future.
Fundamentally, it is a great stock with strong competitive advantage, our fundamental outlook would be buy.
In the monthly range, we see 2 selling pressure bar and 3 buying pressure bar -> bears and bulls fighting out. We see 3 wicks bouncing off $108 level, this shows strong bull defense and foreshadows a breaking up out of the range. Traders should lean bullish when we can up to the upper range.
However if $108 broke we can expect those stubborn bulls to aggressively selling off. My plan right now is to wait for price to get to the upper range and watch for a handle pattern and trade long.


$TSM Good of example of what not to tradeOne of the many things I need to work on is PAYTIENCE... waiting for a good set up and instead end up over trading (usually for a loss).
TSM great example here - resting on 200MA as support ? Possibly. Recently rejected at anchored VWAP could imply a further move down. Middle of channel. Also bottom of wedge... etc
Point is, right now no clear indication of wether TSM will break lower or higher to me so... DON'T TRADE.
Paytience until bottom of channel or break of VWAP. Then reassess and make a trade if it fits.

saying goodbye to my $TSM holdingAfter half a year of holding $TSM average price $119, I will exit with a loss. Was hoping of a break of wedge to the upside. This might be premature, but I will follow my rule for exiting the trade: breaking down the wedge and fell below 200 day.
I might start a position again if the chart turns pretty, it is still a great fundamental play. But for now all out.

ANOTHER DISCOUNT with global chip shortage and declined value of one of the largest suppliers
what you think is going to happen when things go back to normal especially with the increasing demand 🤔
In times of confusion I believe the best opportunities are given
This goes for a semiconductor companies what is technology without it

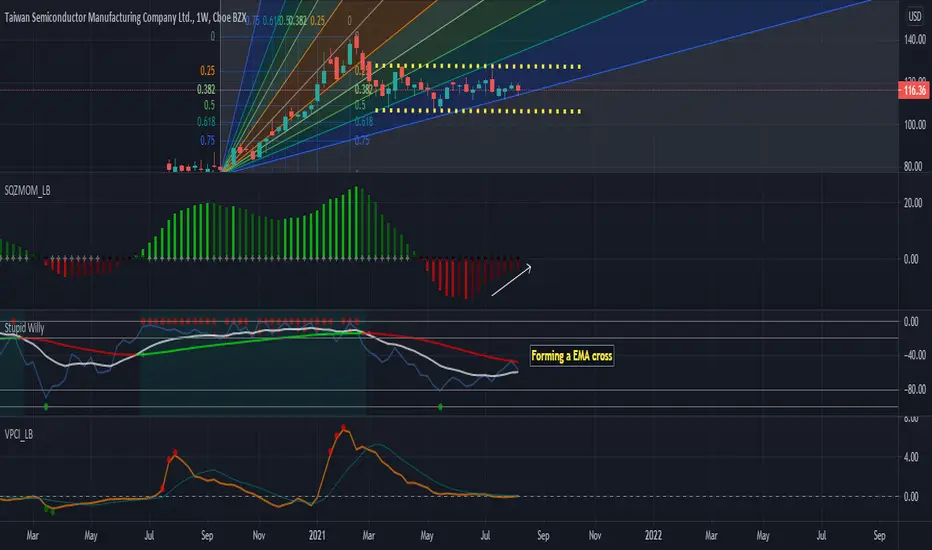
TSM bull entry(setup)Although TSM has been consolidating, it has displayed signals of a bullish move. I think we are seeing a great entry to be taken at the current price since we are seen to be resting at a Fibonacci Support for an even greater chance of an up-move. Not only are we testing a support but we have seen reductions in selling momentum, while also getting signs that emas on the Willy may crossover. We have seen TSM continue to test the resistance of 127 so I believe that is a great target for profits, although I believe we are going to break through that since we are seeing a potential squeeze to be had.
Bullish Signals
-Squeeze indicator
-Willy Oscillator
Price Target
-127
TSM Broke the trend line. How far down will it go now?After a long climb, TSM has broken the trend line to the downside. This is likely to retrace for a while before we see another impulse back up.


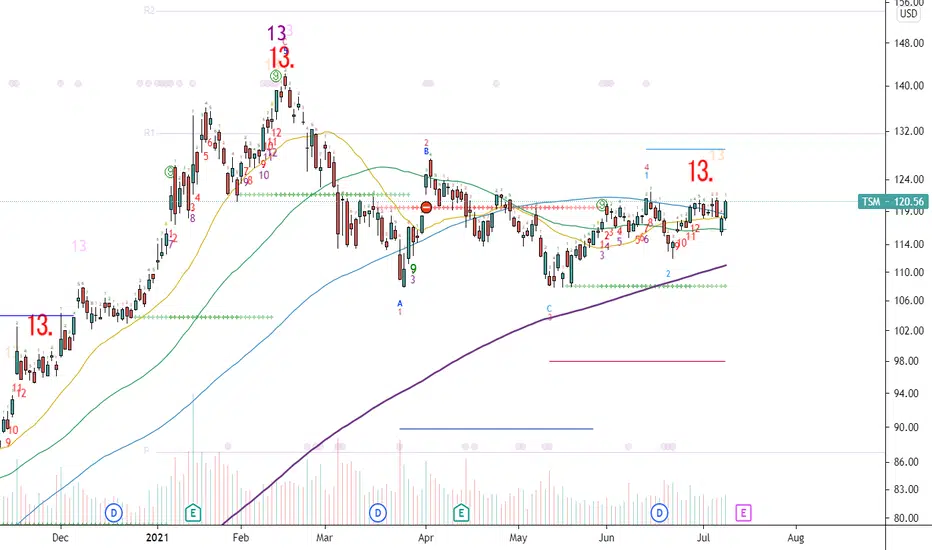
$TSM Taiwan Semiconductor Manufacturing Company +200dmaTSM is looking quite positive on the charts. After correcting from $142 all the way down to $108, the stock managed to print a double bottom at 108 and hold higher. The stock is now also starting to make higher highs and higher lows on the daily which is bullish. Most recently we bounced just above the 200dma and the 50dma is starting to turn higher, still trading above its 200 day moving average. I kind of like the look of this setup..

$TSM with a Neutral outlook following its earnings #Stocks The PEAD projected a Neutral outlook for $TSM after a Negative Under reaction following its earnings release placing the stock in drift D
If you would like to see the Drift for another stock please message us. Also click on the Like Button if this was useful and follow us or join us.

TSM breakout + measured move The chart shows a descending triangle, with a breakout.
The breakout yesterday and today, have been on strong intraday volume.
A measured move can be made by adding the height from the double bottom (purple circles), to the area of the breakout. Using the green arrows to represent the potential move, which takes us to $152 approximately. Which is coincident with the extended move of the fibonacci retracement lines at 61.8%.
$135 and $142 are potential resistance zones, where we could see some profit taking.


$TSM ascending trianglelast week, $AAPL and $AMZN have broken their long consolidation pattern to the upside. Big tech names will likely follow up. $TSM will be my play.
I already have a $TSM position in stocks, but will also play credit spread for this move.

Symmetrical Triangle - TSMBig symmetrical triangle forming on TSM
- Buyer volume starting to pick up again relative to seller volume
- EMA's are all starting to curl upwards (not pictured)
- Bollinger Bands are squeezing
- Will be looking for a breakout at the end of this triangle (broader market conditions permitting)

TSM semi conductor playTSMC is providing chips for AAPL and AMD until they can get their chip shortage under control. A clear winner in the current sprint to catch up, but maybe not for the marathon. American companies should be getting funding in infrastructure bill to help them get ahead in the future, but for now I think this play is the best one. RSI & MACD are currently flat while it continues out of it's consolidation pattern. A break and hold over 121.50 would indicate a retracement of previous run up and track up to target prices of 126/128/131/138 and eventually breaking the ATH of 142.20


Symmetrical Triangle Earnings 7/22TSM appears to be meeting the resistance of the top trendline.
This pattern is neutral until a trendline is broken with a trend in that direction.
No recommendation
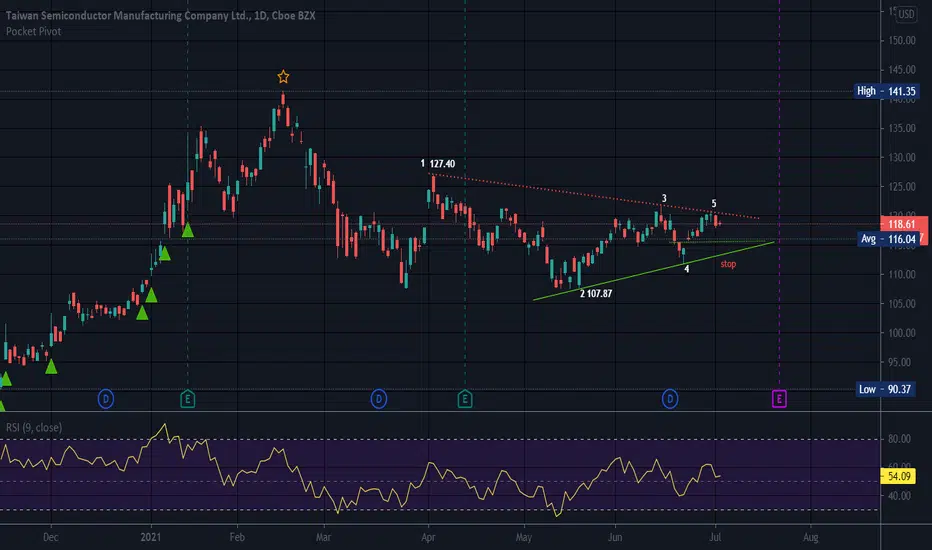
TSM looking bullish after 50% retracement from previous impulse TSM broke our of the descending channel. Now it seems to be consolidating forming a bullish ascending triangle pattern.
Potential to go up to $140 in the near term?
