TWTUSD - Bullish Phase TWT - Backed by Binance
TrustWallet App known and used.
400 Market Cap - 1B Fully Diluted
Good tokenomics.
Good Listings.
Thank you,
St.Gex
TWTUSD trade ideas

TWT is making possible a (+100%) riseTWT is breaking a consolidation since feb 2023, above the value area high from that period and above anchored vwap from 2022 highs. If it manages to close the weekly candle above $1,50 would indicate a possible reach for the last all time high $2,74. The target is between fibonacci extension levels and value area high from the last top. Momentum is shifting to bullish in the higher timeframes and is looking great for continuation.
TARGET: $2,715 to $3,15 up to (+100%)

Trust Wallet TokenTrust Wallet Token
#TWT is expected to finish wave (2) between $0.4227 : $0.2281
The stop-loss shall be below $0.2281 (yet it's preferable to be taken as a long term investment).
The first target should be a new ATH.

TWTUSD - next BNB? Trust Wallet is a Binance-owned project. The marketing team of TWT token is also partially from the Binance. I suppose both projects have the same market-maker. If we compare charts of these two projects (BNBUSD and TWTUSD) you can see similar behaviour of both instruments. I suppose the current price of the TWT is the same as the BNB price 10-20$ in the 2020 year. So I'm waiting for 20-25$ for TWT in 2025.

TWTUSD: Hit our 1.6500 target but now correction is expected.The Trust Wallet Token hit our 1.65000 target (chart at the bottom) much quicker than we anticipated and naturally turned extremely overbought on the 1D timeframe (RSI = 92.623, MACD = 0.152, ADX = 53.524). This 1D RSI is the heighest in TWT's history. If that alone isn't a sell signal, the 1D Golden Cross that was completed on Saturday is one.
Even though that is generally a bullish signal, all of TWT's Golden Crosses on the 1D timeframe, started corrections that approached at least the 0.382 Fibonacci level (normally broken much lower). Consequently we believe that the short term peak has been formed and expect a technical pullback. We target the minimum fractal decline of just over the 0.382 Fibonacci (TP = 1.35000).
See how well our prior idea has worked:
## If you like our free content follow our profile to get more daily ideas. ##
## Comments and likes are greatly appreciated. ##

Will TWT Price Reach $1.35?Above $1: TWT price action shows a significant rise above the psychological mark of $1.
Golden Crossover: The 50-day EMA is rising, hinting at a potential golden crossover.
Next Target: A jump above $1.15 could propel TWT to $1.35.
Bitcoin's Influence: Altcoins like TWT are finding support as Bitcoin stabilizes around $28K.
Bullish Turn: TWT has escaped the 50-day EMA resistance, signaling a bullish trend.
Price Jump: TWT rose from $0.71 to $1, forming higher lows in the process.
46% Growth: The token has gained 46% in the last 40 days, potentially recovering a 25% YTD drop.
Technical Indicators: MACD maintains a positive trend, and the EMAs are signaling a potential golden crossover.
Current Price: TWT is trading at $1.049, with an intraday growth of 0.77%.
Morning Star Pattern: A potential morning star pattern at $1 could indicate a stronger bullish comeback.
Optimistic Scenario: If TWT exceeds $1.15, it could reach $1.35, a 16% hike.
Pessimistic Scenario: Increased selling could lead to a retest of $0.90.

Will TWT Reach $1.25?Sharp Jump: TWT price action shows a bullish breakout.
Golden Crossover: The crucial EMAs are nearing a golden crossover.
200-day EMA: A close above this level could pump TWT to $1.25.
Uptober Spirit: October has been bullish for TWT.
Sideways Movement: Before the rally, TWT was between $0.80 and $0.95.
25% Jump: TWT has risen 25% in the last 12 days.
Price Rejection: TWT faced rejection at $1.05 after crossing $1.
Current Price: TWT is trading at $0.96 with a 1.12% intraday jump.
RSI Status: The daily RSI is nearing the overbought zone.
Retest Phase: TWT is currently in a retest phase after the breakout.
Potential Rally: TWT could jump more than 25% if it sustains above $1.
Downside Risk: Selling pressure could lead TWT to retest $0.90.

TWTUSD: The 1D MA100 may be what's needed for a 1.6500 rally.TWTUSD has crossed today over both the 1D MA50 and MA100 with force turning overbought technically on the 1D timeframe (RSI = 72.444, MACD = 0.001, ADX = 22.204). It hasn't closed a candle over the 1D MA100 since January 29th 2023, so today's closing may be vital for the long term. Even though the 1D MA200 looms just under the R1 level (0.9885), we believe that closing above the 1D MA100, will be the most crucial step towards a four month uptrend targeting the 0.618 Fibonacci level (TP = 1.65000). If it fails to close above the R1 level, we will take a short term sell, aiming at the 1D MA50 (TP = 0.8350).
## If you like our free content follow our profile to get more daily ideas. ##
## Comments and likes are greatly appreciated. ##

TWTUSD Trade the break-outs. Bullish reversal may come soon.Trust Wallet Token (TWTUSD) is trading within a Channel Down pattern since December 2022. Yesterday it touched the Support Zone and rebounded, making a Double Bottom structure so far. At the same time it is restrained by the 1D MA50 (blue trend-line) as the short-term Resistance. There is a medium-term Resistance Zone since mid-June within 0.9700 - 0.9915 and it's where the 1D MA200 (orange trend-line) is headed to.
We see this range within the Support and Resistance Zones as neutral territory and only willing to trade the break-outs above or below. A 1D candle closing above the 1D MA200 would be bullish, targeting the 0.618 Fibonacci retracement level at 1.3000. A 1D candle closing below the 0.7115 Support would be a bearish break-ou, targeting 0.5350, which would be a -46.26% decline from the top, similar to the previous two within the Channel Down.
Notice that a 1D Bullish Cross that is about to be formed, may represent a long-term trend change to bullish.
-------------------------------------------------------------------------------
** Please LIKE 👍, FOLLOW ✅, SHARE 🙌 and COMMENT ✍ if you enjoy this idea! Also share your ideas and charts in the comments section below! **
-------------------------------------------------------------------------------
💸💸💸💸💸💸
👇 👇 👇 👇 👇 👇

TWTUSDTIt is possible that it will remain a final upward wave for it to complete the last sub-wave before the start of a large decline for the shaded areas

TWTUSD Incredible buy opportunity.TWTUSD almost hit two days ago the bottom of the 2 year Channel Up and by that made a technical Higher Low.
Practically that is an incredible buy opportunity on a 1 year basis.
The decline is almost the same (-74%) as the last Higher Lo on February 24th 2022.
Trading Plan:
1. Buy on the current market price.
Targets:
1. 1.4000 (Fibonacci 0.5).
2. 2.5000 (near the All Time High).
Tips:
1. The RSI (1d) got heavily oversold under 20.00 for the first time in the token's history and rebounded over its MA level inside one day. A strong indication that the market deems these levels as a strong demand zone.
Please like, follow and comment!!

TWTUSD Unaffected by the Bear Cycle, going to 2.700 and above.The Trust Wallet Token (TWTUSD) broke yesterday above its 1D MA50 (blue trend-line) for the first time since December 16 2022. With the use of the Fibonacci Channel levels we can identify the long-term bullish trend that the token has been in since its inception, unaffected by the 2022 Bear Cycle.
Three days ago it formed a 1D MA50/1D MA100 (green trend-line) Bearish Cross and as we see on the chart, this has most of the time historically been a bottom signal. As the price is supported right on the 1D MA200 (orange trend-line), we are expecting the green Channel Up to guide it upwards and once it closes above it, lead a rally back to the 2.700 and even the 2.0 Fibonacci extension slightly higher.
-------------------------------------------------------------------------------
** Please LIKE 👍, FOLLOW ✅, SHARE 🙌 and COMMENT ✍ if you enjoy this idea! Also share your ideas and charts in the comments section below! **
-------------------------------------------------------------------------------
💸💸💸💸💸💸
👇 👇 👇 👇 👇 👇

TWT - Oversold- Small BounceThe chart shows that the Trust Wallet Token(TWT) is in an oversold condition.
The indicators used for identifying the oversold condition are the Bollinger Bands, the Relative Strength Index, and the Stochastics. They are all indicating that the condition is oversold and it is likely for a small bounce to the upside before continuing to the downside.
All furter details are shown on the chart.
Goodluck!

TWTUSD - Strong Breakout Within Channel TWTUSD has broken out of a triangle structure very bullishly
This breakout has occurred within an up channel
I expect price to increase to the top of the channel, possibly even breaking the channel
Looks Bullish

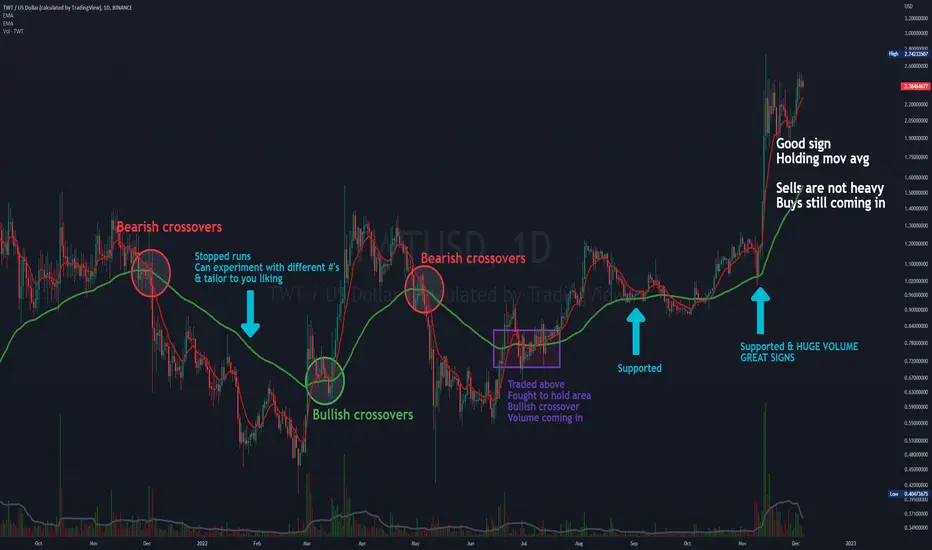
Using $TWT as example for moving avgsMoving Averages
Learn what fits YOUR trading style
Prefer short (& EXPONENTIAL) but have systems with medium & long to get different view
$TWT showed BULLISH moving avg CROSSOVER
Then traded ABOVE the avg's
SAME chart DIFFERENT #'s
10 & 20 vs 10 & 80
Just copy paste
Also had weekly view to help
Next targets for Trust Wallet (TWT)The token is valued above average... a point outside the curve in this bad context.
I would expect a pullback for a possible entry.

TWTUSDTNot a financial advise.
No problem for TWT until break down the acsending channel down side at the Horizontal Support at 0.92 level. The target for the current triangle is 4.7, don't look up for the direct target as shown on chart, but will take time.
DYOR


TWT/USDT By @3mmar_q8yOne of the most bullish charts I have seen in a while
previously 5 Eliot wave after that a cup and handle and now with a bigger cup and handle with a bullish flagpole bullish pattern

Trust Wallet TWT looking good!Trust Wallet TWT presented a bullish "Bartley" with a second low at the 88% retrace, broke out of the supply line, made a third higher low where it back-tested the breakout. Judging by the volume its a fight between the bulls and bears. But if the hidden bullish divergence is right on the MACD, the bulls will win. My targets are $1.42, $1.65, and $1.75.

Trust wallet token analysisTrust Wallet crypto analysis of the most used electronic wallet, token trust wallet (TWT), strong support on which the price bounces several times, cryto similar to that of Binance which shows a very large evolution BINANCE:TWTUSD .

TRADE PLAN FOR TWT FOR PROFITSHello traders, another opportunity to set our trades and wait for pending orders to get filled. Let the games come to you nd enjoy.
Tradehubng.

Technical look at the twt coin chartTechnical look at the twt coin chart
New Trade
Entry:1.02 (-0.39%)
Target 1: 1.13(10.78%)
Target 2: 1.23(20.59%)
Target 3: 1.5(47.06%)
Stoploss: 0.86(15.69%)
Curruent Price: 1.024
Risk/Reward:-15.69%/47.06%
