$TWT/USDT Breakout Confirmed.SEED_DONKEYDAN_MARKET_CAP:TWT just broke a major downtrend and retested the breakout zone around $0.7555–$0.7898, holding above the 100 SMA.
If this support holds, we could see a 25% move toward $0.9528. Bullish structure, momentum building.
DYOR, NFA
TWTUSDT trade ideas

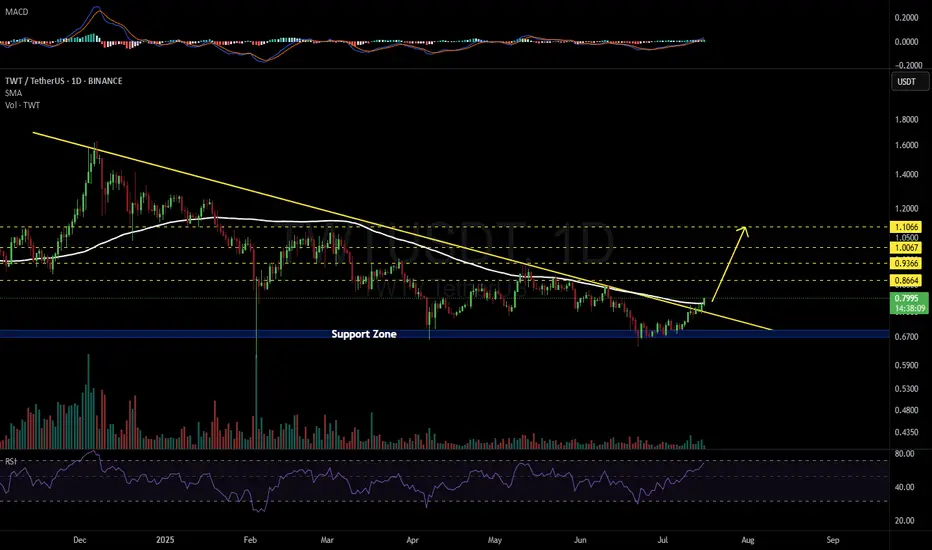
TWTUSDT 1D#TWT has broken above the descending resistance on the daily chart. Now it's breaking out above the daily SMA100.
If it manages to close the daily candle above the SMA100, the following targets are on the table:
🎯 $0.8664
🎯 $0.9366
🎯 $1.0067
🎯 $1.1066
⚠️ Always use a tight stop-loss and apply proper risk management.
twt 1h fib retractement & unswept liquidity We can clearly see that price has recently touched the 0.5 Fibonacci retracement level and subsequently pulled back to the 0.7 region. What's particularly interesting to me is that the liquidity within that grey box below hasn't been swept yet.
My current conviction is that price is likely headed down to that grey zone to collect the pending liquidity. This area around the $0.66 - $0.70 range looks like a prime target for a retest, potentially offering a good confluence for a bounce or at least a significant reaction. We'll need to watch for confirmation, but the setup suggests a continuation lower in the short term to tap into that unmitigated demand.

TWT Pullback to support area!!!Buy gradually from here or wait for a pullback to the support area with a short-term target of at least 10%+.

TWTUSDT 1D AnalysisTWT ~ 1D Analysis
#TWT Successfully broke through this resistance line. Buy at this support block with a short term target of at least 10%+ from here.

TWT ANALYSIS🚀#TWT Analysis :
🔮As we can see in the chart of #TWT that there is a formation of "Falling Wedge Pattern". Some time ago the same structure was made and it performed well and this time also the same is happening with a perfect breakout
🔰Current Price: $0.8464
🎯 Target Price: $1.0865
⚡️What to do ?
👀Keep an eye on #TWT price action. We can trade according to the chart and make some profits⚡️⚡️
#TWT #Cryptocurrency #TechnicalAnalysis #DYOR

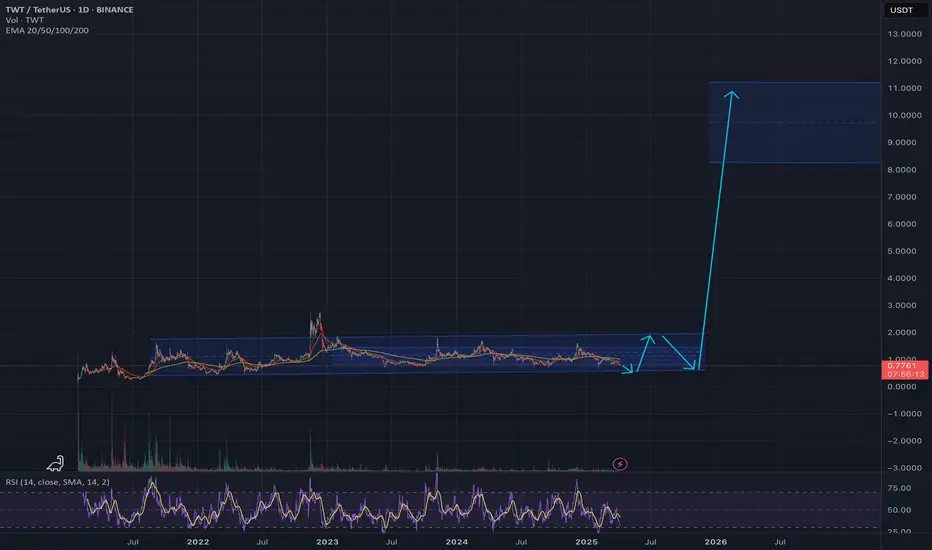
If this is not accumulation, I don't know what isSince launch BINANCE:TWTUSDT was sitting in a steady price corridor, while most other coins were having exceptional volatility. Sooner or later, hype waves will pass and larger adoption will settle, empty tokens will disappear after burning through VC funds and ones capable of self-sustaining and generating revenue will stay and prosper. Wallet model is one of the most sustainable at it's core, and Trust Wallet has been profitable for more than a year already. Its revenues and profits are growing and this accumulation might explode into $7-$11 area to never come back. What we see now will be that tiny part of the chart that you see in ETH and other tokens as a long past opportunities. A bet on a real business model that serves people and generates real live revenue is what I see here. Backed by Binance and CZ himself, I see very little chances of dramatic price drop, at least if crypto in general has a future - TWT's chances to prosper there are higher than most other tokens.
Thesis: buy accumulation, wait long-term and take profits at $7 to $9.
univers Of Signals | TWT: Navigating Trust Wallet's Market Moves👋 Welcome to univers Of Signals !
In this analysis, I'll be reviewing the TWT coin, a part of the Trust Wallet project, which is currently ranked 126th on CoinMarketCap with a market cap of $358 million.
📅 Daily Timeframe
As you can see in the daily timeframe, we're observing a very large range box from 0.7832 to 1.5725, where the price is currently near the bottom of this box.
✅ The floor of this box is a significant support range from 0.7832 to 0.8321 and is acting as a demand zone for the price.
🔽 Currently, the price has reached the 0.8321 area, tested it once with a shadow, and received support from it. If this area breaks, we'll enter the support zone, and we'll need to see how the price reacts to this zone.
📊 The market volume is very low, and for now, it seems there isn't enough strength and momentum in the market to break this area, but if a selling volume enters the market and the RSI goes into oversell, the likelihood of breaking this area increases. In this case, the next support will be at 0.6215.
🛒 For buying this coin, I recommend waiting until it exits the range box it has created, as this would indicate upward momentum entering the market. Currently, there is no momentum in the market. Thus, the best trigger from my perspective is the breakout at 1.5725.
📈 However, for a long position or a risky spot purchase, you could enter upon the breakout of 1.0556. I mainly consider this trigger for futures, and for spot purchases, I would wait until the main resistance is broken.
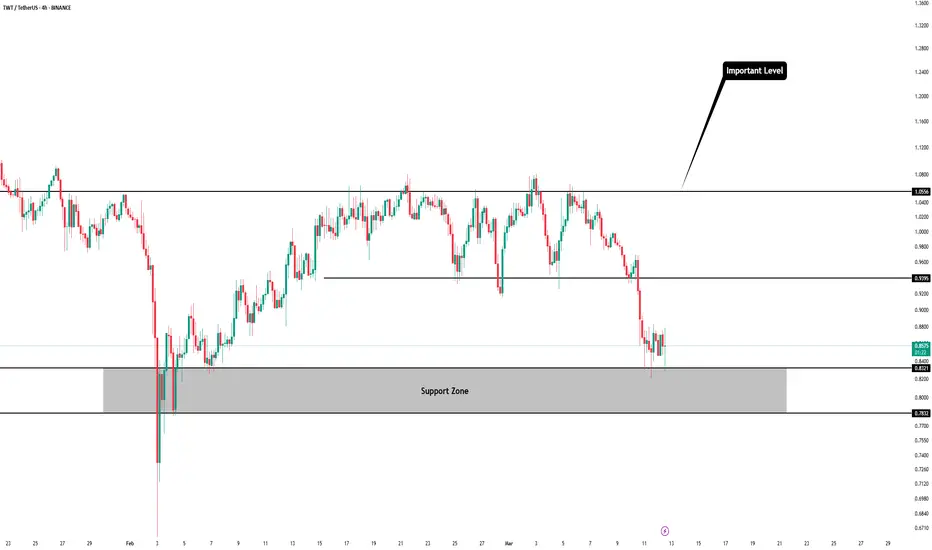
⏳ 4-Hour Timeframe
In the 4-hour timeframe, as you see, we had a box between 0.9395 to 1.0556, which has been cleanly broken from below, and you could open a short position with price consolidation below this area.
💥 Currently, the price has reached the next support at 0.8321 and has shown some reaction. The RSI is currently in oversell, and if it receives support from this area, it could return to the normal range.
📉 For short positions, the triggers at 0.8321 and 0.7832 are suitable. The 0.8321 trigger is riskier, and I suggest waiting until the 0.7832 support is lost before opening a more secure position.
🔼 For long positions, there's a very suitable ceiling at 1.0556, and breaking this area could lead to opening a long position.
📝 Final Thoughts
This analysis reflects our opinions and is not financial advice.
Share your thoughts in the comments, and don’t forget to share this analysis with your friends! ❤️
TradeCityPro | TWT: Navigating Trust Wallet's Market Moves👋 Welcome to TradeCityPro!
In this analysis, I'll be reviewing the TWT coin, a part of the Trust Wallet project, which is currently ranked 126th on CoinMarketCap with a market cap of $358 million.
📅 Daily Timeframe
As you can see in the daily timeframe, we're observing a very large range box from 0.7832 to 1.5725, where the price is currently near the bottom of this box.
✅ The floor of this box is a significant support range from 0.7832 to 0.8321 and is acting as a demand zone for the price.
🔽 Currently, the price has reached the 0.8321 area, tested it once with a shadow, and received support from it. If this area breaks, we'll enter the support zone, and we'll need to see how the price reacts to this zone.
📊 The market volume is very low, and for now, it seems there isn't enough strength and momentum in the market to break this area, but if a selling volume enters the market and the RSI goes into oversell, the likelihood of breaking this area increases. In this case, the next support will be at 0.6215.
🛒 For buying this coin, I recommend waiting until it exits the range box it has created, as this would indicate upward momentum entering the market. Currently, there is no momentum in the market. Thus, the best trigger from my perspective is the breakout at 1.5725.
📈 However, for a long position or a risky spot purchase, you could enter upon the breakout of 1.0556. I mainly consider this trigger for futures, and for spot purchases, I would wait until the main resistance is broken.
⏳ 4-Hour Timeframe
In the 4-hour timeframe, as you see, we had a box between 0.9395 to 1.0556, which has been cleanly broken from below, and you could open a short position with price consolidation below this area.
💥 Currently, the price has reached the next support at 0.8321 and has shown some reaction. The RSI is currently in oversell, and if it receives support from this area, it could return to the normal range.
📉 For short positions, the triggers at 0.8321 and 0.7832 are suitable. The 0.8321 trigger is riskier, and I suggest waiting until the 0.7832 support is lost before opening a more secure position.
🔼 For long positions, there's a very suitable ceiling at 1.0556, and breaking this area could lead to opening a long position.
📝 Final Thoughts
This analysis reflects our opinions and is not financial advice.
Share your thoughts in the comments, and don’t forget to share this analysis with your friends! ❤️

Long Entry Signal for TWT/USDTBased on the daily chart for TWTUSDT on Bybit, here's a concise analysis:
MLR vs. SMA: The MLR (blue) is above the SMA (pink), indicating a bullish trend.
MLR vs. BB Center: The MLR is above the BB Center Line (orange), suggesting bullish momentum.
PSAR: The PSAR dots (black) are under the price, confirming a bullish trend.
Price vs. SMA 200: The price is above the 200-period SMA (red), supporting a long-term bullish trend.
Current Strategy: Since all entry conditions for a long position are met (MLR above SMA, MLR above BB Center, PSAR under price, price above SMA 200), you might consider entering a long position.
Stop Loss (SL): Set the stop loss at the current level of the PSAR dots to manage risk.
Monitor My Idea: Keep monitoring my idea for any changes in trend or for potential profit-taking opportunities.

TWT TO MOON? LET'S SEEWe might see a skyrocketing increase in this coin based on the LUTA indicator. However, you should still adhere to a stop-loss in case the price drops.

Trading opportunity for TWTUSDTBased on technical factors there is a Sell position in :
📊 TWTUSDT
🔴 Sell Now
🪫Stop loss 1.0800
🔋Target 0.9000
📏 R/R 2
💸RISK : 1%
We hope it is profitable for you ❤️
Please support our activity with your likes👍 and comments📝

TWT Short Levels | BTC | ETH | LTC | TRUMPTWT First resistance 4hr MA which is $1 testing.
2nd resistance 200DMA
3rd 50DMA
Stop loss below $1.06
Without leverage

Univers Of Signals | TWT: Trust Wallet Token's Market Moves👋 Welcome to Univers of Signals !
In this analysis, I want to examine the TWT coin for you. This coin is associated with Trust Wallet, which you are undoubtedly familiar with and have used. It's a very user-friendly wallet that even beginners can use easily. Currently, TWT has a market cap of $382 million and is ranked 142 on CoinMarketCap.
📅 Weekly Time Frame
In the weekly timeframe, after the price reached the area of 2.7081, which was also the ATH, a corrective phase in the market began and continued down to 0.7072.
🔍 During this period, we also had an ascending trendline accompanying the upward trend, which was broken. After a pullback to the trendline area at 1.6072, a price range box between 0.7072 and 1.6072 has formed, with several supports and resistances occurring at the box's floor and ceiling.
📊 The market volume has been decreasing since the pullback and is gradually declining, compressing the price further. A breakout above 1.6072 could potentially initiate an uptrend. If the box's support fails, there are two short-term supports at 0.5774 and 0.4761, though these are not very significant. The main support is at 0.2960.
⚡️ Moreover, the RSI in its chart has a support area at 38.44, which is also significant. A break of this area in conjunction with a break below 0.7072 in the chart could confirm the entry of significant bearish momentum.
🛒 For spot buying, the trigger at 1.6072 is appropriate. If the price consolidates above this area, we can expect it to move towards the ATH and test this area again.
🔽 As I mentioned, the ascending trendline has been broken and has been pulled back to, so if the trendline trigger at 0.270 activates and this support breaks, we can expect the price to move towards the trendline target of 0.2960.
📝 Final Thoughts
This analysis reflects our opinions and is not financial advice.
Share your thoughts in the comments, and don’t forget to share this analysis with your friends! ❤️

TradeCityPro | TWT: Trust Wallet Token's Market Moves👋 Welcome to TradeCityPro!
In this analysis, I want to examine the TWT coin for you. This coin is associated with Trust Wallet, which you are undoubtedly familiar with and have used. It's a very user-friendly wallet that even beginners can use easily. Currently, TWT has a market cap of $382 million and is ranked 142 on CoinMarketCap.
📅 Weekly Time Frame
In the weekly timeframe, after the price reached the area of 2.7081, which was also the ATH, a corrective phase in the market began and continued down to 0.7072.
🔍 During this period, we also had an ascending trendline accompanying the upward trend, which was broken. After a pullback to the trendline area at 1.6072, a price range box between 0.7072 and 1.6072 has formed, with several supports and resistances occurring at the box's floor and ceiling.
📊 The market volume has been decreasing since the pullback and is gradually declining, compressing the price further. A breakout above 1.6072 could potentially initiate an uptrend. If the box's support fails, there are two short-term supports at 0.5774 and 0.4761, though these are not very significant. The main support is at 0.2960.
⚡️ Moreover, the RSI in its chart has a support area at 38.44, which is also significant. A break of this area in conjunction with a break below 0.7072 in the chart could confirm the entry of significant bearish momentum.
🛒 For spot buying, the trigger at 1.6072 is appropriate. If the price consolidates above this area, we can expect it to move towards the ATH and test this area again.
🔽 As I mentioned, the ascending trendline has been broken and has been pulled back to, so if the trendline trigger at 0.270 activates and this support breaks, we can expect the price to move towards the trendline target of 0.2960.
📝 Final Thoughts
This analysis reflects our opinions and is not financial advice.
Share your thoughts in the comments, and don’t forget to share this analysis with your friends! ❤️

Prepare to BUY Spot TWTUSDT (M Cycle)🚀 Prepare to BUY Spot TWTUSDT (M Cycle)
🌟 The M cycle for TWTUSDT indicates the accumulation phase is nearing completion – A prime setup for exponential returns! 🌟
🌍 Market Overview:
TWTUSDT is in the final stages of forming a bottom and accumulation phase for its M cycle. This creates an excellent opportunity to accumulate before the anticipated strong uptrend.
📊 Trade Plan:
📌 Entry Point:
Ideal accumulation range: $0.97 - $1.27, with priority on buying at $0.97 or lower.
🎯 Target:
x5 - x6 potential return as the M cycle develops.
⏳ Hold Time:
6 months or until the end of 2025, depending on the progression of the cycle.
💡 Note:
Accumulate gradually within the recommended price range to optimize entry.
Stay alert for confirmation of upward momentum and monitor market trends.
Patience will be key to fully capitalizing on this setup.
🔥 TWTUSDT is ready for a significant move – Take advantage of this accumulation phase now! 🔥

TWT/USDT One Hour Chart - LongTWT/USDT One Hour Chart - Long Call
Two targets are clearly visible as green lines

TWTUSDT Long IdeaThis chart represents a technical analysis of the TWT/USDT pair using a daily timeframe on Binance. The analysis incorporates trend channels, support and resistance levels, and RSI divergence as key indicators to gauge potential price movements.
Technical Analysis:
- Trend Channels: The highlighted channels show the broader market movements and the range in which the price tends to oscillate. The current structure suggests that TWT has recently rebounded from a strong support zone, marked around $0.77, which aligns with historical price action.
- Support and Resistance Zones:
- Strong support is observed around $0.77, a level that has been respected multiple times.
- Key resistance levels align at $1.50 and $2.00, where previous sell-offs have occurred.
- RSI Divergence: The RSI divergence indicator highlights potential trend reversals. Bullish signals were marked near lows, confirming a bounce-back, while bearish signals appeared at key resistance zones. At present, RSI is neutral but leaning toward a potential bullish setup.
Project Insights:
Trust Wallet Token (TWT) is a governance and utility token for the Trust Wallet ecosystem, enabling users to participate in decisions related to wallet features and upgrades. With the rising adoption of decentralized wallets and the focus on secure, self-custodial solutions, TWT holds significant utility for DeFi enthusiasts. Its utility spans trading fee discounts, governance, and rewarding users for participation.
Analysis Expectation:
This chart has been shared as part of ongoing research and tracking efforts. The outlined setup is not financial advice but rather an observation of potential price movements based on technical indicators and market behavior. The expectation leans towards a gradual test of the upper trend channel, contingent on market conditions and broader crypto sentiment.
Let’s continue to monitor these zones for potential confirmations!

TWTHey
My idea is that GLOBAL correction on TWT is developing
Wave C either truncated and already completed or will reach my initial target 2-2.20$
Join me on X

#TWT/USDT Ready to go higher#TWT
The price is moving in a descending channel on the 1-hour frame and sticking to it well
We have a bounce from the lower limit of the descending channel, this support is at 1.23
We have a downtrend on the RSI indicator that is about to break, which supports the rise
We have a trend to stabilize above the 100 moving average
Entry price 1.24
First target 1.268
Second target 1.288
Third target 1.31

TWTUSDT Analysis: Waiting for the Right EntryBuyers are active in TWTUSDT, but waiting for the blue boxes to form is the more logical approach for a solid entry.
Key Insights:
Active Buyers: The market shows buying pressure, but the blue box offers a more reliable demand zone for a better risk-reward.
Patience is Key: Waiting for the blue box aligns with a more controlled entry, especially in the current market conditions.
Confirmation Checklist:
When trading the blue box, I will confirm using:
Cumulative Delta Volume (CDV)
Liquidity Heatmap
Volume Profile
Volume Footprint
Upward Market Structure Breaks on Lower Time Frames
Learn Advanced Trading Techniques:
Want to dive deeper into CDV, liquidity heatmaps, or volume profiles? DM me for personalized guidance.
Final Words:
Stay patient, wait for the blue box, and trade with confidence!
If you think this analysis helps you, please don't forget to boost and comment on this. These motivate me to share more insights with you!
I keep my charts clean and simple because I believe clarity leads to better decisions.
My approach is built on years of experience and a solid track record. I don’t claim to know it all, but I’m confident in my ability to spot high-probability setups.
If you would like to learn how to use the heatmap, cumulative volume delta and volume footprint techniques that I use below to determine very accurate demand regions, you can send me a private message. I help anyone who wants it completely free of charge.
My Previous Analysis (the list is long but I think it's kinda good : )
🎯 ZENUSDT.P: Patience & Profitability | %230 Reaction from the Sniper Entry
🐶 DOGEUSDT.P: Next Move
🎨 RENDERUSDT.P: Opportunity of the Month
💎 ETHUSDT.P: Where to Retrace
🟢 BNBUSDT.P: Potential Surge
📊 BTC Dominance: Reaction Zone
🌊 WAVESUSDT.P: Demand Zone Potential
🟣 UNIUSDT.P: Long-Term Trade
🔵 XRPUSDT.P: Entry Zones
🔗 LINKUSDT.P: Follow The River
📈 BTCUSDT.P: Two Key Demand Zones
🟩 POLUSDT: Bullish Momentum
🌟 PENDLEUSDT.P: Where Opportunity Meets Precision
🔥 BTCUSDT.P: Liquidation of Highly Leveraged Longs
🌊 SOLUSDT.P: SOL's Dip - Your Opportunity
🐸 1000PEPEUSDT.P: Prime Bounce Zone Unlocked
🚀 ETHUSDT.P: Set to Explode - Don't Miss This Game Changer
🤖 IQUSDT: Smart Plan
⚡️ PONDUSDT: A Trade Not Taken Is Better Than a Losing One
💼 STMXUSDT: 2 Buying Areas
🐢 TURBOUSDT: Buy Zones and Buyer Presence
🌍 ICPUSDT.P: Massive Upside Potential | Check the Trade Update For Seeing Results
🟠 IDEXUSDT: Spot Buy Area | %26 Profit if You Trade with MSB
📌 USUALUSDT: Buyers Are Active + %70 Profit in Total
🌟 FORTHUSDT: Sniper Entry +%26 Reaction
🐳 QKCUSDT: Sniper Entry +%57 Reaction
📊 BTC.D: Retest of Key Area Highly Likely
I stopped adding to the list because it's kinda tiring to add 5-10 charts in every move but you can check my profile and see that it goes on..

TWTUSDT 1WTWT Update ~ 1W
#TWT Successfully retested this Support,. and for now it still maintains its bullish structure. If you still have Conviction on this coin,. Buy in stages from here. with a minimum target of 20%++

#TWT (SPOT) entry range ( 1.200- 1.376)T.(2.520) SL( 1.160)BINANCE:TWTUSDT ( Infrastructure )
Entry ( 1.200- 1.376)
SL 4H close below 1.160
T1 1.800
T2 2.000
T3 2.520
______________________________________________________________
Golden Advices.
********************
* collect the coin slowly in the entry range.
* Please calculate your losses before the entry.
* Do not enter any trade you find it not suitable for you.
* No FOMO - No Rush , it is a long journey.
Useful Tags.
****************
My total posts
www.tradingview.com
1Million Journey
www.tradingview.com
www.tradingview.com
**********************************************************************************************
#Manta #OMNI #DYM #AI #IO #XAI #ACE #NFP #RAD #WLD #ORDI #BLUR #SUI #VOXEL #AEVO #VITE #APE #RDNT #FLUX #NMR #VANRY #TRB #HBAR #DGB #XEC #ERN #ALT #IO #ACA #HIVE #ASTR #ARDR #PIXEL #LTO #AERGO #SCRT #ATA #HOOK #FLOW #KSM #HFT #MINA #DATA #SC #JOE #RDNT #IQ #CFX #BICO #CTSI #KMD #FXS #DEGO #FORTH #AST #PORTAL #CYBER #RIF #ENJ #ZIL #APT #GALA #STEEM #ONE #LINK #NTRN #COTI #RENDER #ICX #IMX #ALICE #PYR #PORTAL #GRT #GMT #IDEX #NEAR #ICP #ETH #QTUM #VET #QNT #API3 #BURGER #MOVR #SKL #BAND #ETHFI #SAND #IOTX #T #GTC #PDA #GMX #REZ #DUSK #BNX #PYTH #TWT
