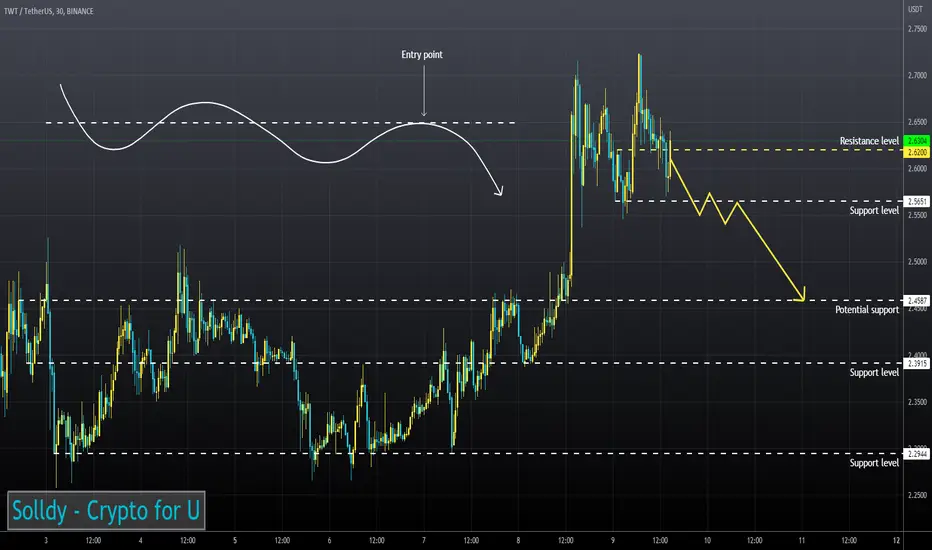
TWTUSD ❕ bearish divergenceOn the 4H Timeframe price formed a bearish divergence and TD Sequential formed a downward reversal signal.
On the 1H and 30m Timeframes, price and RSI formed a bearish divergence, confirmed by trading volumes.
I expect a fall after the price fixes under the support level.
TWTUSDT trade ideas
TWT: Approaching ResistanceTrust Wallet Token (TWT) technical analysis:
Trade setup : Price broke out of Pennant (bullish) and reached $2.75 resistance. Now wait for price to break above $2.75 resistance to resume Uptrend. (set a price alert).
Pattern : Bullish Pennant - forms typically following a sharp advance, followed by a brief triangular shaped consolidation in price (a small change in direction), before the previous uptrend (bullish) typically resumes. The period of consolidation should have lower volume and the breakouts should occur on higher volume.
Trend : Uptrend across all time horizons (Short- Medium- and Long-Term).
Momentum is Bullish ( MACD Line is above MACD Signal Line and RSI is above 55).
Support and Resistance : Nearest Support Zone is $1.80, then $1.25. The nearest Resistance Zone is $2.75.


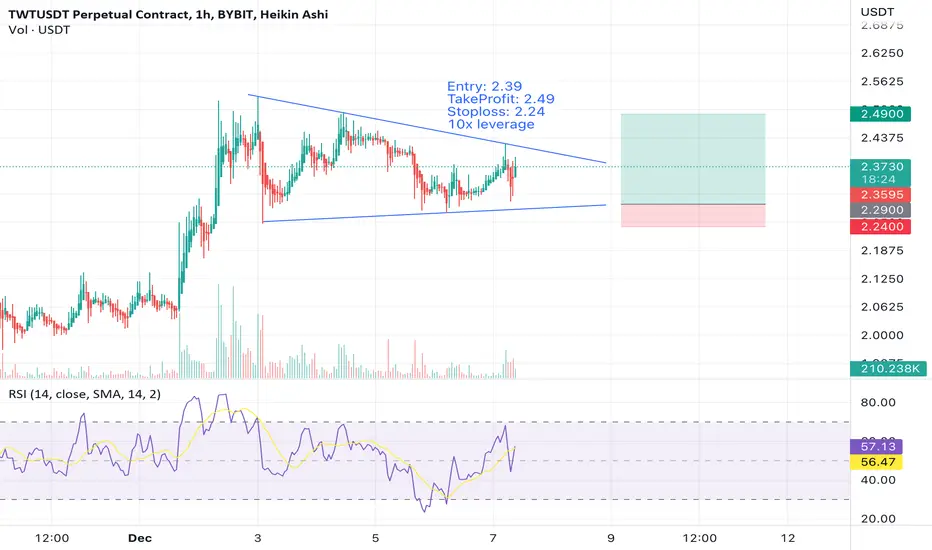
TWT: Triangel SCALPSo now is 50% 50% but i think we will see pump!
Give me like if you agree and check other analysis (i have one more on bigger timeframe TWT)

TWT : LONG-TERM PRICE PREDICTION DEPENDING ON A VIEW INDICATORA view indicator shows that this coin is able to go higher targets. this will stay an expecting as we can't see the future.
The indicator did test before also on AXS and other increased coins.
Into this prediction for 2022/2023 a price target of 11 USD.
Conducting research on Trust Wallet Coin (TWT) and considering its potential performance in the long term is a smart move. By keeping an eye on the market and staying up-to-date on changes and updates, you may be able to identify opportunities for TWT to show strong price action. However, it is important to remember that any price prediction is just an estimation and not a guarantee of future performance. It is always advisable to invest responsibly and within one's means. It can also be beneficial to regularly monitor the market and stay up-to-date on the latest developments in the industry.
This is not trading advice, as it's only a price expected for 2022/2023
Trade and invest only depending on your study.
# for day traders it's much better to follow the price day by day.
The reason for this update is also that this coin has a chance to become a hype coin since its just some important trends.
Also on side of whales there is an invest auto DCA trend.

Twt hit the Strong Resistance Best point to sell twt at dynamic resistance level
Price Pull back to previous resistance 1.5 $

keeps risingThis chart has been created for education & entertainment and this is not a trading advice

LONG TRADE ON TWT/USDT, PROFIT TARGET AROUND 8%MY SIGNALS ARE ALWAYS FOR DAY TRADERS, MOST OF THE TRADE CLOSE WITHIN A DAY.
Warning: Please take your own risk, i am not your financial advisor and this is not an investment advice.
TWTThe TWT cryptocurrency has taken the upper price zone, and is now moving in a flat. Constantly testing levels 2.30 and 2.50! Now we are at the lower price level, and most likely we will go for a reversal again. I have already said that we can rebound to this price. But still optimistic that we will go beyond the upper limit and begin to grow with renewed vigor!

Trust Wallet Token (TWT) formed Cypher | A good buy opportunityHi dear friends, hope you are well and welcome to the new trade setup of Trust Wallet Token (TWT) with US Dollar pair.
Previously we caught a nice trade of TWT
Now on a 4-hr time frame, TWT has formed a bullish Cypher pattern.
Note: Above idea is for educational purpose only. It is advised to diversify and strictly follow the stop loss, and don't get stuck with trade


TWTOnce again I am convinced that TWT works out technical analysis very well. What to expect next from this coin? Now on the chart, we see that the asset has formed a bullish flag pattern. And it has already bounced off the upper resistance level at 2.50 three times, which at this stage is the main price line. Breaking through which will give prospects for a further growth cycle in the 2.80-3.00 range! And from this price zone, we may be able to see high market volatility. And although there is a possibility of a drawdown to 2.35 or even 2.30, I still think that the market will be inclined to buy!

TWTUSDTHello Crypto Lovers,
Mars Signals team wishes you high profits.
This is a 4-hour-time frame analysis for TWTUSDT
According to our previous analysis on November 20, we predicted a rising trend to happen and our prediction came true after some days since the date. Therefore, R1 is our resistance area which contains the disability of the price in order to rise. S1 used to be a long-term resistance line and S2 is the support area in which the well support of price is obvious. At the moment, we have the fluctuation of price below R1 area and we predict a rise for it to reach the mentioned area and then by being rejected, we will wait for some falling sings and subsequently a decline would take place down to lower amounts such as S1. If the price is able to mover over R1 and fixes itself there, more rise is waiting for it. Let's wait and see what happens in the future and wait for our updates.
Warning: This is just a suggestion and we do not guarantee profits. We advise you to analyze the chart before opening any positions.
Wish you luck

TRUST WALLET IDEAHello guys this my trading ideas about TWTUSDT .
LIKES and FOLLOW for more ideas Thanks you .

TWT: Bullish Pennant Breakout!Trade setup : After massive gains (>100%), price briefly consolidated in a Bullish Pennant pattern. Now price appears to have broken above the Pennant resistance (bullish) line to resume uptrend with upside to $2.75 resistance zone.
Pattern : Bullish Pennant - forms typically following a sharp advance, followed by a brief triangular shaped consolidation in price (a small change in direction), before the previous uptrend (bullish) typically resumes. The period of consolidation should have lower volume and the breakouts should occur on higher volume.
Trend : Uptrend across all time horizons (Short- Medium- and Long-Term).
Momentum is Mixed as MACD Line is below MACD Signal Line (Bearish) but RSI > 55 (Bullish). MACD Histogram bars are rising, which suggests that momentum could be nearing another upswing.
Support and Resistance : Nearest Support Zone is $1.80, then $1.25. The nearest Resistance Zone is $2.75.

TWTUSD ❕ broke up the trianglePrice has fixed above 50EMA (4H TF)
TWT trades on liquidity.
I expect further upside if the asset fixes above the current level.

TWTUSDT (continuation of growth)Hello traders,
Based on the chart, it looks like we're in triangle, im in pos from 2.15
Entry: market and lower
Targets: 2.5 - 2.8 - 3
after first target reached move ur stop in breakeven!
SL: ~1.75
Risk/Reward: 1 to ~3
Good luck!
Please, feel free to share your point of view, write it in the comments below, thanks!

Will Trust Wallet Token Continue Straight Up To $3.45The really high volume here on this chart reminded me of Band Protocol, the analysis we shared earlier...
Now, Trust Wallet Token (TWTUSDT) hit a low in May 2022 and has been on an uptrend since.
In the past few weeks, we see a strong bull-run taking place, within a bear market.
Q: Can it continue growing and hit $3.47?
A: It depends.
As we can see from the chart above, the Fib. extension resistance 1.618, the Golden Ratio, is set at $2.318.
TWTUSDT hit this level but produced a long upper wick/shadow just two weeks ago.
This is an important level and can decide if this altcoin pair will retrace or continue moving straight up.
If this level can be taken out/conquered, prices moving and closing above it, we can see another impulse which would take prices to $3.45.
But if instead TWT fails to break this level, a correction can easily take place (red arrow).
So far it is looking like the important resistance will be challenged again.
Check the chart for additional information.
Visit my profile for more trades.
Hit Boost, Comment & Follow.
Thanks a lot for your support.
Namaste.

TWTI pay a lot of attention to the TWT cryptocurrency. At the moment, this is my favorite token, which I have high hopes for next year. Despite the huge declines in other altcoins, TWT behaved quite steadily last year and showed good growth in November. Which was the first signal for me to buy this cryptocurrency. Now this asset is moving in a triangular pattern. And it clearly forms a horizontal support line at the price of 1.84! From where he had already rebounded more than once. In the near future, the chart should break through the boundaries of the pattern, after which I expect increased volatility. Given that over the past time the lower level has not been broken, we will see a new growing cycle. Happy trading everyone!


🔥 TWT Triangle Pending Break OutSome time ago I made an analysis on TWT and the Fibonacci reversal we found. In the end, we didn't reach the $2.75 value, but still got a nice 10% move. The low at $1.82 held, so the signal is still valid.
Currently, I'm looking at a different pattern on this asset. Over the course of the last two weeks or so, a clear triangle pattern can be drawn on the chart.
In my view, the most likely break out will be a bullish one. In case of a confirmed break out, I'm looking at the blue lines as potential profit targets.

TWT/USDTTWT/USDT
Formed a flag pattern.
I think it can have another upward movement.
The targets are indicated in the picture.
Hello dear traders.
Well, first of all, let's introduce ourselves.
We gathered some of the best traders from all over the world to provide the best services. From Canada, Germany, England, America and even Iran.
Why should you choose the operation? There are several reasons for this that I will mention below:
1- Our monthly profit is over 1000% and with the exchange that we introduce, if the crypto market becomes boring, we use forex in the same exchange.
2- As announced in the text, we selected the best traders from the graduates of the best universities in the world.
3- For some time, our service and signaling in the public channel is completely free and you can use it.
4- We do not claim to be the best, we prove this in practice.
5- You can use our free training.
And finally, we wish the best for you dear ones.

TWTUSDT | BULLISH SETUPTWT has been in a strong bullish trend.
The price is now converging with in a channel.
The bulls need to break above the channel.
The bulls are in control.
Manage your levels accordingly.
