Consolidating the UFT trendApril is the month of the strongest seasonal growth in the first half of the year. In the first half of the month, the probability of purchase disruptions prevails against the background of the negative closing of the last quarter, however, as we approach the middle of the month, the probability of
Related pairs

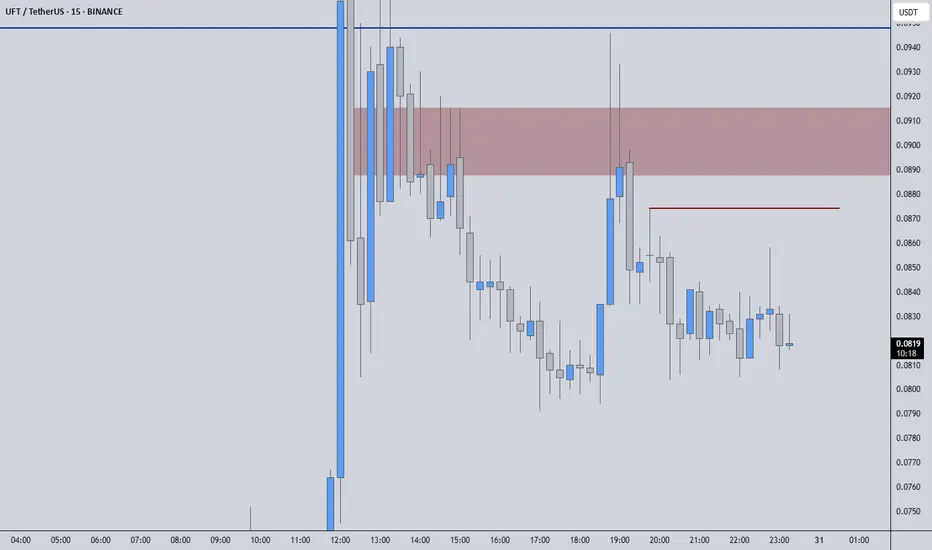
UFTUSDT – High-Precision Short Opportunities!UFTUSDT has faced a sharp decline, confirming the accuracy of our pre-identified key levels. Now, we focus on the red box and red line as prime shorting zones. This is not guesswork—these levels are carefully selected using Volume Footprint & Time Price Opportunities, tools that most traders don’t e
UFT are preparing for a trend reversalFollowing the alpaca testing, OG is ready to give a similar picture with an attempt to overtake the previous impulse. The previous impulse has already rechecked the opening level of the year with a local overlap, which opens the way for a test of levels 6 and 7.5. With the current market and the con

UFTUSDTWe can attempt to buy UFTUSDT from specified level as it makes HL , also 0.786 FIB level intact indicate that it moves upward.
SL , TP mention in chart.

UFTUSDT: 126% VOLUME SPIKE DAILY | DONT SLEEP!UFTUSDT has witnessed a 126% increase in volume within 24 hours.
While buyers appear to be active, it is important to note that this is a low market cap coin, meaning the price may continue to decline despite buyer activity.
For potential trades:
Monitor upward breakouts from the blue boxes

UFT ANALYSIS (1D)You can see the chart based on liquidity pools. On the left side, a large pool has been hunted and the reaction was a long shadow.
The price is creating a pool on the right side of the chart to hunt this pool and reach the origin of the previous hunt.
In this range (green range) we are looking for

Trading Signal: UFTUSDT MovementPair: UFTUSDT
Direction: Sell
Enter Price: 0.2464
Take Profit: 0.24336667
Stop Loss: 0.25226667
We have detected a potential short-selling opportunity for the UFTUSDT trading pair using the EASY Quantum Ai strategy. This strategy analyzes several factors that contribute to this f

UFTUSDTWe can attempt to short UFTUSDT from specified level as it break HL , also there is bearish divergence occur indicate that it moves downward.
SL , TP mention in chart.

UFTUSDT.1DAs I analyze the daily chart of UFT/USDT, several key patterns and levels stand out to me.
Resistance and Support Levels
Resistance Levels:
R1: The first significant resistance level is around $0.2499. This level aligns with previous highs and acts as a potential target if the bullish momentum con

UFTUSDT.2HLet's conduct a technical analysis of the UFT/USDT chart you've provided:
Timeframe: The chart shows a 2-hour timeframe which is useful for short to medium-term trade analysis.
Ichimoku Cloud: The price action is below the Ichimoku Cloud, indicating a bearish sentiment. If the price remains below

See all ideas
Summarizing what the indicators are suggesting.
Oscillators
Neutral
SellBuy
Strong sellStrong buy
Strong sellSellNeutralBuyStrong buy
Oscillators
Neutral
SellBuy
Strong sellStrong buy
Strong sellSellNeutralBuyStrong buy
Summary
Neutral
SellBuy
Strong sellStrong buy
Strong sellSellNeutralBuyStrong buy
Summary
Neutral
SellBuy
Strong sellStrong buy
Strong sellSellNeutralBuyStrong buy
Summary
Neutral
SellBuy
Strong sellStrong buy
Strong sellSellNeutralBuyStrong buy
Moving Averages
Neutral
SellBuy
Strong sellStrong buy
Strong sellSellNeutralBuyStrong buy
Moving Averages
Neutral
SellBuy
Strong sellStrong buy
Strong sellSellNeutralBuyStrong buy
Displays a symbol's price movements over previous years to identify recurring trends.
Frequently Asked Questions
The current price of UniLend / USDT (UFT) is 0.006024 USDT — it has fallen −0.45% in the past 24 hours. Try placing this info into the context by checking out what coins are also gaining and losing at the moment and seeing UFT price chart.
UniLend / USDT price has risen by 17.47% over the last week, its month performance shows a −18.76% decrease, and as for the last year, UniLend / USDT has decreased by −98.21%. See more dynamics on UFT price chart.
Keep track of coins' changes with our Crypto Coins Heatmap.
Keep track of coins' changes with our Crypto Coins Heatmap.
UniLend / USDT (UFT) reached its highest price on Feb 23, 2021 — it amounted to 4.800000 USDT. Find more insights on the UFT price chart.
See the list of crypto gainers and choose what best fits your strategy.
See the list of crypto gainers and choose what best fits your strategy.
UniLend / USDT (UFT) reached the lowest price of 0.005060 USDT on Jun 22, 2025. View more UniLend / USDT dynamics on the price chart.
See the list of crypto losers to find unexpected opportunities.
See the list of crypto losers to find unexpected opportunities.
The safest choice when buying UFT is to go to a well-known crypto exchange. Some of the popular names are Binance, Coinbase, Kraken. But you'll have to find a reliable broker and create an account first. You can trade UFT right from TradingView charts — just choose a broker and connect to your account.
Crypto markets are famous for their volatility, so one should study all the available stats before adding crypto assets to their portfolio. Very often it's technical analysis that comes in handy. We prepared technical ratings for UniLend / USDT (UFT): today its technical analysis shows the sell signal, and according to the 1 week rating UFT shows the sell signal. And you'd better dig deeper and study 1 month rating too — it's sell. Find inspiration in UniLend / USDT trading ideas and keep track of what's moving crypto markets with our crypto news feed.
UniLend / USDT (UFT) is just as reliable as any other crypto asset — this corner of the world market is highly volatile. Today, for instance, UniLend / USDT is estimated as 0.03% volatile. The only thing it means is that you must prepare and examine all available information before making a decision. And if you're not sure about UniLend / USDT, you can find more inspiration in our curated watchlists.
You can discuss UniLend / USDT (UFT) with other users in our public chats, Minds or in the comments to Ideas.