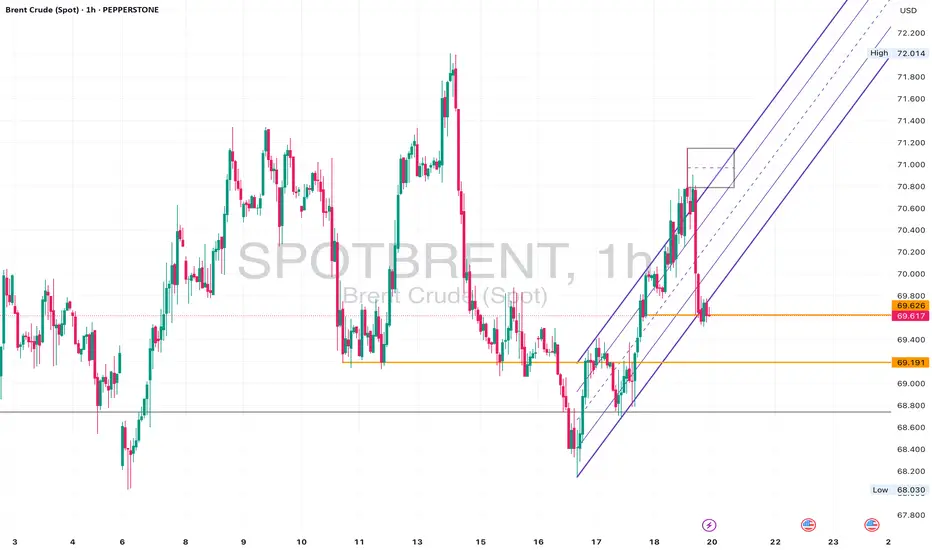
Brent UKOil - Neutral Slightly Bearish • Daily: Price is sitting above long-term trendline support, but momentum is waning.
• 4H: Structure looks indecisive with constant failures near 71.00.
• 1H: Recent break of the upward channel. Now retesting that zone from below.
⚠️ Watch For:
• Retest of 69.60–70.00 as resistance.
• Break an
Possible Bullish Setup on 1Hr Brent Crude.Possible bullish setup on the 1hr Brent.
A break below setup triggers a bearish position to target price area.
Best of luck in all your trades.

Oil Brent I think Brent oil will make another low and then rise again to the $90 range and then have a sharp correction.
Majidbabaeiasl Tehran iran
1404 / 05/02

Crude Oil Setup in ProgressOil is in an uptrend, and I expect it to continue.
At the moment, the stop-loss would be too wide — around 3.5%, which is a bit too much for my portfolio, especially considering I already have a wide stop on palladium.
On the 1-hour chart, I’m watching for a possible entry slightly below the curre

BCOUSD Long Swing Setup – Holding Support with Upside PotentialNYSE:BCO is currently sitting on a key support level, offering a potential long spot entry as buyers defend the $69.50 zone. A bounce from here could open the way for a move toward higher resistance levels.
📌 Trade Setup:
• Entry Zone: Around $69.50
• Take Profit Targets:
o 🥇 $73.50 – $76.00
o 🥈

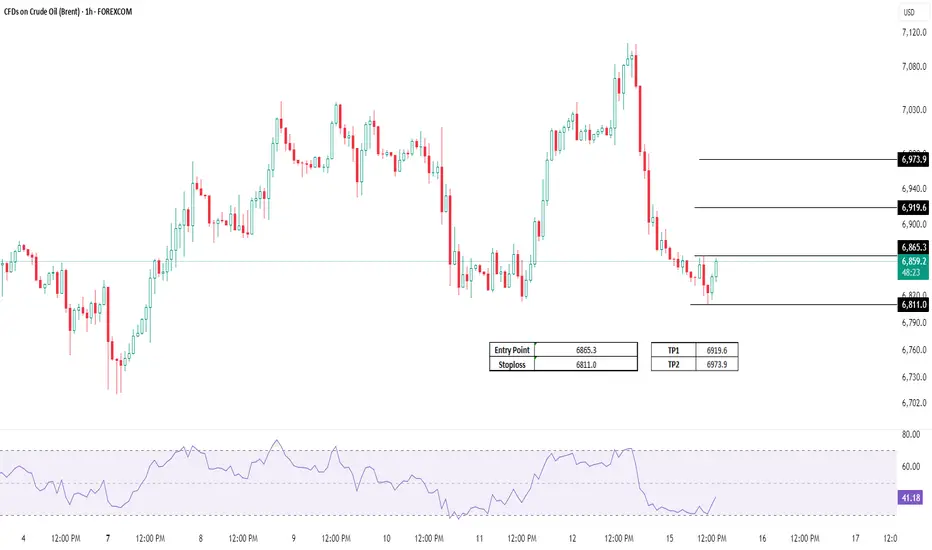
Brent Crude Oil loss of support now resistance at 7050Key Support and Resistance Levels
Resistance Level 1: 7050
Resistance Level 2: 7130
Resistance Level 3: 7220
Support Level 1: 6800
Support Level 2: 6700
Support Level 3: 6590
This communication is for informational purposes only and should not be viewed as any form of recommendation as to a p

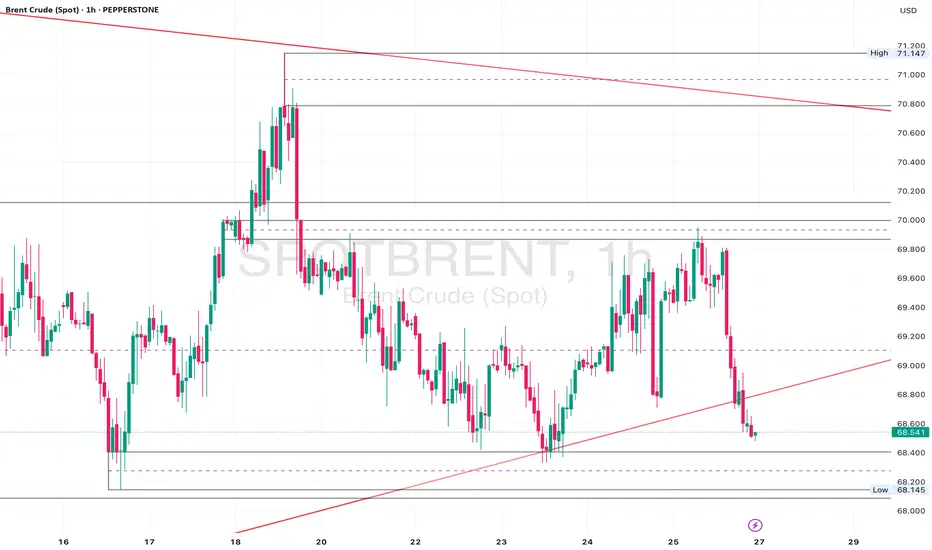
Brent Crude Sitting at Key Support – 69.20 Hold for a Rebound?Daily Analysis:
Price is holding above the ascending trendline and forming higher lows. Multiple rejections from the 68.00 region suggest strong demand. As long as we remain above the trendline, bulls stay in control.
4H Analysis:
Pullback after rejecting 71.00. Now sitting inside the 69.60–69.20 d
Brent Oil H4 | Heading into a swing-high resistanceBrent oil (UKOIL) is rising towards a swing-high resistance and could potentially reverse off this level to drop lower.
Sell entry is at 70.39 which is a swing-high resistance that aligns closely with the 78.6% Fibonacci retracement.
Stop loss is at 71.90 which is a level that sits above the 127.2

Brent Crude Oil capped by resistance at 7050 Key Support and Resistance Levels
Resistance Level 1: 7050
Resistance Level 2: 7130
Resistance Level 3: 7220
Support Level 1: 6800
Support Level 2: 6700
Support Level 3: 6590
This communication is for informational purposes only and should not be viewed as any form of recommendation as to a p

See all ideas
Displays a symbol's price movements over previous years to identify recurring trends.