ULTIMA getting close to KEY levels⚡️ Hello everyone! The long-awaited alt season has begun, and liquidity is actively spreading across the market. Now is the time to take a closer look at assets that could be the next big thing.
As you know, ULTIMA has been on my radar for a long time. It is one of the most promising tokens. It has survived a powerful correction and is now trading around its key level, trying to find a foothold.
The chart shows that:
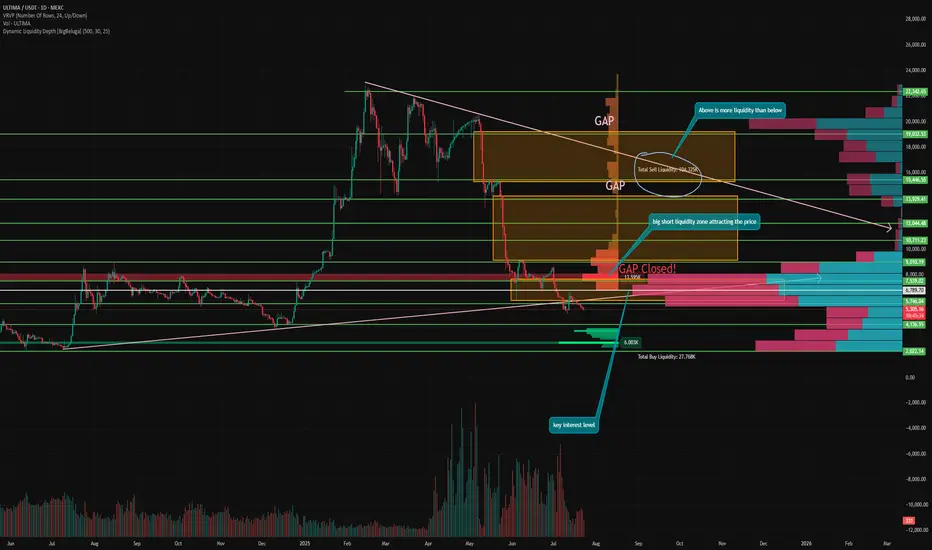
➡️ the nearest GAP at $7,687 - $6,022 has been closed, as I said. After all, 99% of GAPs close sooner or later, and the remaining two GAPs at the top continue to attract the price.
➡️ Liquidity Depth shows that there is significantly more liquidity at the top than at the bottom. This means that a large number of shorts accumulated during the correction. And as we know, the price moves from liquidity to liquidity because it needs fuel to move.
➡️ VRVP shows that the key point of interest for ULTIMA right now is the $7,850 level, around which the asset has been trading for the last few months. Now, after closing the GAP at the top, the price has naturally corrected, but this level is definitely the next attractive target for the price.
➡️ In addition, levels from $8,250 to $5,710 are highly active, which shows high interest in ULTIMA at such low prices.
📌 Conclusion:
It is now too late to enter heavy alts that gave +100% per day. Because the next day you can get -100% back.
It is much safer to choose assets that have just gone through a correction phase and are gaining strength for the next move. These are the easiest to accelerate, which means they have greater potential 🔥
ULTIMAUSDT trade ideas
Ultima final push before new high?⚡️ It's time to update the idea on Ultima, as interesting movements are beginning in the token!
Closing the GAP from below at $7694 - $6038. The price approached the first level of buyer demand, as well as strong support at $5737.
Even lower, there was a huge range of buyer interest, so any move beyond that level could potentially be bought back in the blink of an eye.
⚙️ Metrics and indicators:
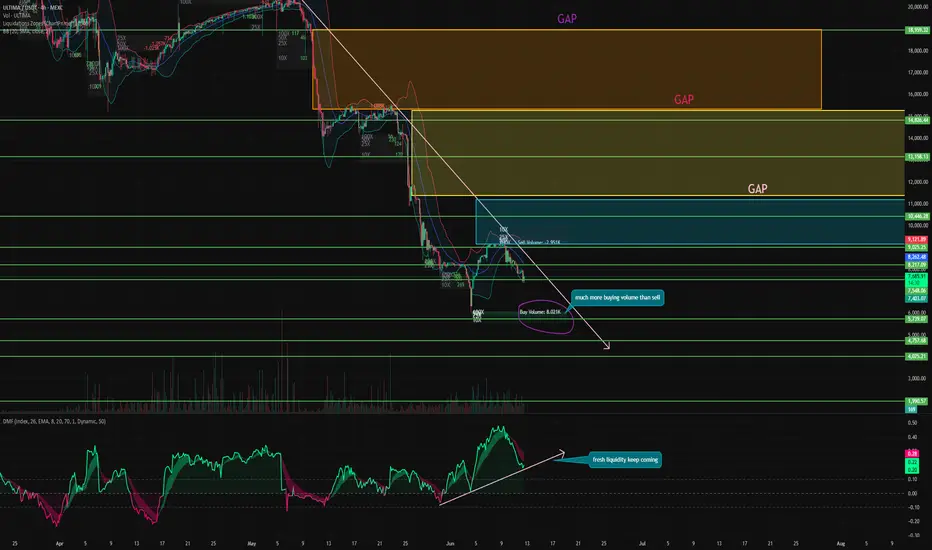
Volume - continues to show divergence with price; as the price falls, sales volumes also continue to decline, signaling the exhaustion of sellers.
Liquidity Depth - there is almost three times more liquidity at the top than at the bottom. And as we know, the price moves from one level of liquidity to another, which serves as fuel for it.
Money Flow - despite the prolonged correction, there is a steady inflow of fresh capital. Although positions also continue to close. However, the indicator is still in the neutral zone, which indicates that there are no panic sales in the asset right now.
In addition, the indicator is now testing the inclined support, which is historically a bullish sign in a bull market.
📌 Conclusion:
Right now, ULTIMA may be nearing the end of its correction phase. When sellers have already depleted their stocks and no one else wants to sell at current prices.
So I advise you to buckle up and start watching the asset closely, because right now it is very light and when it goes up, it will literally fly with huge candles! 🔥

ULTIMA will herald a bullish momentum for the ENTIRE market⚡️ Hello, everyone! There is panic in the market, with Bitcoin crashing to $98,000 overnight. I predicted this correction in advance, and those who read my ideas knew about it.
But now the question arises: where to put liquidity if the market is falling? And I have the answer for you!
🔔 Now that the market has just begun its correction, you need to pay attention to those assets that have already completed their correction and are now in a trading range, gathering strength for further growth.
And ULTIMA is one of them!
➡️ While the top 5 altcoins lost more than 10% over the weekend, ULTIMA fell by only 8% . This suggests that sellers simply cannot push the price lower. The asset has been in correction for a long time and has probably reached its local bottom.
Two gaps have formed at the top: the first at 9,220-14,250, the second at 15,340-19,250. And as we know, 99% of gaps close sooner or later . Just as Bitcoin closed its gap from below yesterday.
📈 The price itself is in a flag and is approaching its sloping support, which historically provokes powerful rebounds in a bull market.
⚙️ Metrics and indicators:
Money Flow - an indicator of capital inflow into an asset. One of the key metrics for any token. And in ULTIMA, fresh liquidity has been coming in for more than six months! Even throughout the entire correction!
Supply and Demand - the price is driven by these two basic metrics. And now, below the current price, at the level of 6,660 - 6,200, a large level of demand has formed. This pushes the price back up and prevents it from falling lower. And if the price cannot fall lower, it means it will go higher.
Volume - sales volumes continue to decline throughout the correction. This is a signal that seller pressure is weakening and control may soon shift to the bulls.
📌 Conclusion:
At times like these, it is necessary to look at those tokens that have already gone through their correction phase and are now gathering strength for the next surge.
After all, they will be the first to go up, while the rest of the market is still declining and looking for a fair price for each asset.

ULTIMA next move is already here! Hello, everyone!
⚡️ After reaching a low of 6,090, the price of ULTIMA rebounded with good buying volume and has now corrected slightly.
Attention has returned to the token, so let's take a look at what lies ahead for ULTIMA:
The price has probably bottomed out and is now close to its sloping resistance. A breakout could signal the likely start of a new trend for the token. In addition, three gaps have already formed above! And as we know, in 99% of cases, gaps close sooner or later.
⚙️ Several other indicators also point to this:
Money Flow - as I said earlier, liquidity continued to flow into the token throughout its correction, demonstrating strong trader confidence. However, at current levels, there has been a real boom, pushing the indicator up to 0.48, which was last seen at a price of $20,000!
Liquidation zones - there is noticeable buyer demand at the local bottom. Almost 4 times more than the nearest liquidity point in shorts. And as I always say, the price moves from one liquidity zone to another. But this is only the local level, and in the global picture, there are huge layers of short liquidity above $10,000.
Bollinger Bands - the candle closed below the lower wave for the first time and the price rebounded strongly. This potentially signals oversold conditions and possibly a bottom has been found.
📌 Conclusion:
ULTIMA is still gaining strength. Nothing moves from trend to trend. There are phases of “accumulation” and “distribution.” ULTIMA experienced redistribution at levels of $20,000.
And now, having found the bottom, the token can finally move into the accumulation phase, gathering strength for the next impulse.
✅ As I said, this is one of the most promising altcoins right now. This is because Bitcoin is already beginning its correction, and liquidity will start to flow into altcoins, especially those that are undervalued and easier to move. So I am definitely keeping an eye on ULTIMA and looking for an entry point.
Have a nice day, everyone!
ULTIMA is about to explode, and here's why⚡️ Hello, everyone! Not long ago, I wrote about my idea that ULTIMA is one of the most undervalued assets on the market right now.
And now this prediction is starting to come true. While the entire market is declining, ULTIMA is showing growth of more than 25% per day.
The correction phase has come to an end, and now a new growth impulse may be emerging, and here's why:
⚙️ Metrics and indicators:
Volume - throughout the correction, sales volumes declined, forming a divergence, which indicates a likely trend reversal.
DMF - throughout the correction, fresh liquidity continued to flow into the asset, and in the last two days there has been a powerful surge in liquidity, raising the indicators to 0.33!
Liquidity Depth - as we know, the price moves from one liquidity to another. Liquidity serves as fuel for the price, and now a huge layer of liquidity has gathered above, while there is practically none left below us.
📊 Technical Analysis:
There are also two huge gaps above at the 11,300 - 15,300 and 15,400 - 19,000 levels. And as we know, in 99% of cases, gaps close sooner or later.
Support at the 8,200 level is one of the key levels, which, if it can be maintained, could lead to an upward momentum to collect short sellers' liquidity.
📌 Conclusion:
Now that the market is declining, liquidity will begin to flow into altcoins, particularly those that are currently the cheapest and easiest to move.
ULTIMA is one such coin. Having been in a correction phase for the past month, the token is now very attractive for purchases and movements.
I have been building up a small spot position throughout the correction and now plan to sit back and watch the show.
Have a great summer, everyone! ☀️

One of the MOST UNDERVALUED assets with huge POTENTIAL? ULTIMA continues its correction and by the looks of it, the end of the correction is getting closer.
⚡️ Let's see why I think there is a huge potential here in the short term.
The current correction is caused by the start of the token unlocking period after the freeze and many of them went straight to the market. However, they are not in a hurry to pay off yet.
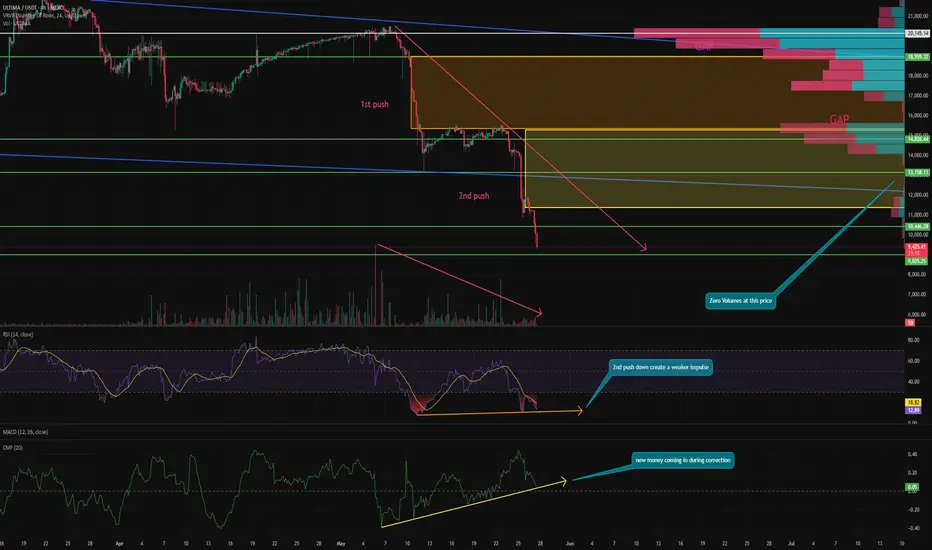
Now, above are two huge GAPs. The first one is $11,400 - $15,320 and the second one is $15,400 - $19,000. As you know, GAPs are 99% of the time closed sooner or later. Especially such huge ones that leave behind such untraded areas.
📰 On every impulse, historically, there are 3-4 down pushes. Right now, ULTIMA has completed the second one. Not sure what the 4th will be, given what impulses were on the first two. So the next one (if there is one) could be the last and entail a BOS and a return to growth.
⚙️ Metrics and indicators:
Volume - the entire correction that started as early as $20,000 continues on lower selling volume, signaling seller exhaustion. Potentially signaling a rebound in the short term.
RSI - the second impulse was weaker than the first and a divergence was formed on the indicator chart. Which indicates a potential change of trend back to growth.
CMF - here is the most interesting thing. During the whole correction, fresh liquidity continues to enter the token. Also forming a divergence.
This indicates that holders continue to accumulate the coin. 🔥
VRVP - shows that at the price of $14,000, trading volumes have almost completely disappeared. The asset was probably overheated speculatively as it gave over 500% in a short period of time last year alone. And the current correction is landing gamblers with shoulders that obviously don't want to re-enter and go try their luck further.
Small volumes have started to appear in the $11,000 zone. Which, combined with the fact that we know we could be in for another downward momentum, is very correlative. After all, we are seeing more and more volume at a low price and the next impulse may just spark interest from those who have been waiting for a lower price for a long time.
📌Conclusion:
My first key point was $10,000. The next one will be $8,000. I don't expect a move below $6,000. But am buying at each key point so I don't miss the upside and average the position. Not trying to guess where the long awaited bottom is.
ULTIMA SHOWS SAME PATTERN AS BTC BEFORE EXPLOAD TO THE 100K🔥 Ultima has formed a bullish descending flag pattern on the daily chart. The same pattern led BTC to an explosive rise to $100,000 at the end of the previous year.
This pattern is historically a correction in a bullish trend and breaks to the upside, continuing the rise.
Ultima has been one of the strongest technologically backed tokens this cycle . The token has risen in value by over 1000% from its low in the summer and now, having set a new atx, is consolidating under it, gaining strength for the next momentum.
Last weekend was a strong shakeout for leveraged traders and the price corrected to key support at $15,000. And on top of that, a FVG (Fair Value Gap) formed above, which 99% of the time closes sooner or later.
⚙️ Metrics and indicators:
RSI - hit 16.9, which historically signifies an oversold zone and leads to at least a short-term bounce. The last time the RSI reached these levels, Ultima's price rose 469% in 2 months.
MACD - after a prolonged decline, is now approaching to converge and give a bullish cross section, historically signifying a return to an uptrend.
EMA - price has reached the 200 EMA level on the daily chart and is trying to consolidate above, as we all know, the first test of the 200 EMA in a bull market usually leads to explosive buy impulses.
Volume - the entire correction took place over the weekend on lower volumes, dropping gamblers with shoulders. Major buying followed as early as the weekdays with many times the volume.
🌐 Fundamental:
Ultima is a strong project with a good background in the form of a strong dev and marketing team. The token made it to the top 200 CMC in no time. Holds events all over the world and participates itself, presenting really good products like cryptocard.
And the freshly launched in April, trading bot has increased the trading volume of the token many times, which is perfectly visible on the chart. I think many traders were actively shorting at this time, because despite the huge volumes of buyers, there were no strong upward impulses, so now there is a lot of liquidity at the top. And as we know, the price of an asset moves from liquidity to liquidity, it is its fuel.
📌 Conclusion:
The token is now clearly undervalued by the market by all metrics and technical analysis. So it is expected at least a technical bounce, which it has already started by the way, to close the GAP in the range of $15,357 - $20,240.
I have gained a spot position in the support zone of $13,100 - $14,814, with an average entry price of $13,560 and expect at least a return to the listing peak level, at about $18,959, a consolidation above which would probably mean a new ATH.
