UMA | Very Easy, High Probability 200% Bullish TargetMy dear friend, this chart setup is high probability; This target is very easy, it can net 200% profits in the coming weeks or days. Don't let the simplicity get in your way.
We are looking UMABTC on the daily timeframe.
I don't know if there is anything to explain as the chart leaves no room for d
Related coins

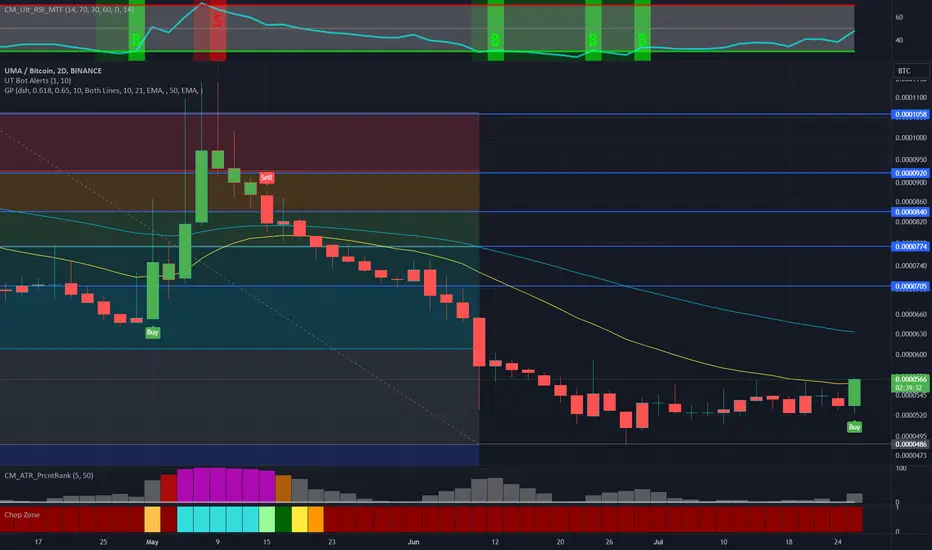
✳️ UMA Prepares Major Bull-Market (1984% Or 6597% Final Target)In just two weeks, fourteen days, UMABTC produced a 360% bullish wave, this to mark the bottom for this pair... A bull-market is now ready to start.
After a classic retrace below 0.618 Fib. retracement, support is being tested as EMA50.
Here is the chart:
Short-term it can be tricky as there is r

UMA Buy Signal + TargetsUMA is getting more bullish now
Seems like 000564 will break soon as current resistance level. (as engulfing candle
Also the yellow EMA is broken on this time frame (candle closes soon)

umabtc break out Uma breaks out the downtrend daily and makes X2, now we are waiting for the close of the weekly candle; with the divergence observed, we will wait for a 500% gain at least.


UMA/BTC potential breakout! - textbook falling wedge, watch for breakout but wait for at least daily close above it. UMA likes to fakeout.
- higher low/double bottom
- weekly StochRSI crossing up
- more frequent tests of upper trendline with good volume
- if UMA breaks out of the falling wedge, it can move quickly
- curr

UMABTC 8h long setup; Breakout of 1.5 year downtrendTA explained
Starting with the bigger picture for UMA using the 1W TF. A long lasting downtrend (starting at Sept 2020) was broken at the start of November with a very strong bullish weekly candle, after which the price pullback and retested the broken TL.
Zooming into the 8H TF we can see two in

UMA 1000% potential FIB Targets UMA is somehow at all time low with btc pair
This can be a great opportunity for getting in
not financial advice
do your own research before investing money
for any questions please DM me or leave a comment bellow

Universal Market Access (UMA) Universal Market Access (UMA) - A fast, flexible, and secure way to create synthetic assets
UMA, is a protocol for the creation of synthetic assets based on the Ethereum (ETH) blockchain. Synthetic assets are a class of assets that represent different, underlying assets and have the same value. UM

See all ideas
Summarizing what the indicators are suggesting.
Oscillators
Neutral
SellBuy
Strong sellStrong buy
Strong sellSellNeutralBuyStrong buy
Oscillators
Neutral
SellBuy
Strong sellStrong buy
Strong sellSellNeutralBuyStrong buy
Summary
Neutral
SellBuy
Strong sellStrong buy
Strong sellSellNeutralBuyStrong buy
Summary
Neutral
SellBuy
Strong sellStrong buy
Strong sellSellNeutralBuyStrong buy
Summary
Neutral
SellBuy
Strong sellStrong buy
Strong sellSellNeutralBuyStrong buy
Moving Averages
Neutral
SellBuy
Strong sellStrong buy
Strong sellSellNeutralBuyStrong buy
Moving Averages
Neutral
SellBuy
Strong sellStrong buy
Strong sellSellNeutralBuyStrong buy
Displays a symbol's price movements over previous years to identify recurring trends.