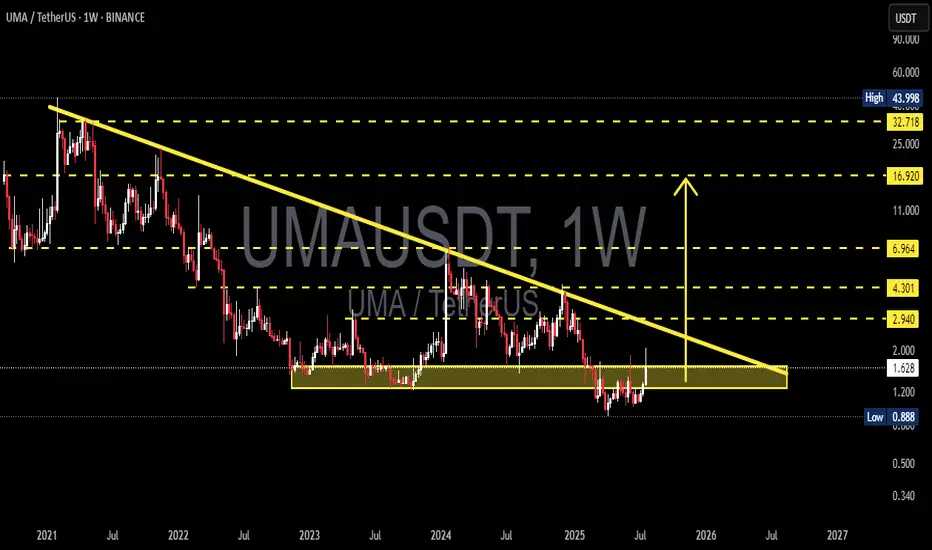
UMA/USDT Weekly Analysis – At the Edge of Compression?📉 Chart Overview:
UMA/USDT has been in a long-term downtrend since its peak in 2021. For nearly three years, price action has been trapped within a descending triangle pattern, forming consistent lower highs while holding a strong horizontal support zone around $0.88 – $1.20.
Over the last two yea
Related pairs
UMA · $6.65 Easy Target · Much Higher Possible Late 2025 · 1220%$6.65 is actually a very easy and conservative target. We tend to cap profits potential when we approach the market using leverage. When doing spot, we get all the targets all the way to a new all-time high—price discovery—and beyond.
Here we have a very strong bullish chart setup. Consider this. W

#UMA/USDT#UMA
The price is moving within a descending channel on the 1-hour frame, adhering well to it, and is heading toward a strong breakout and retest.
We are experiencing a rebound from the lower boundary of the descending channel, which is support at 1.36.
We are experiencing a downtrend on the RSI

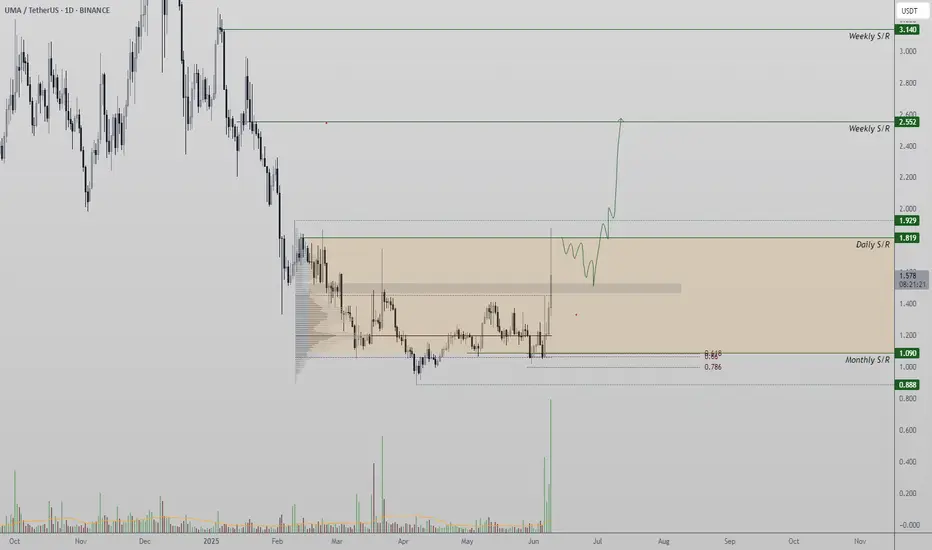
UMA/USDT – Can the 26% Pump Hold? Or Is a Full Retrace Incoming?UMA surged 26.54% from a high-confluence support zone, but price is now facing rejection near the $1.80 level. A key test is underway to determine if this rally has legs or if it was just a deviation.
Key Highlights:
Rejection wick formed at $1.80, signaling local resistance
Key support sits at $1
Uma Update: How To Use Moving Averages For Trading SuccessThe moving averages can be an excellent tool for trading, you can use them to confirm where the market is headed next. I no longer use them as often as before but you can use them all the time to know which pair is weak and which one is strong.
When the action is happening daily above EMA55/EMA89,

Uma Is Yet To Move: 5X Low Risk Lev. Trade Setup (PP: 3500%)This is a good chart setup and I'll tell you why, UMAUSDT is yet to move. Maximum growth from its 7-April low amounts to 58%. The current price trades some 40% above its correction bottom. Seeing some pairs growing already 300% and 400%, this means that UMAUSDT is still early. For this reason, we ca

UMA Successfully breakout this resistant lineSuccessfully breakout this resistant line with a short -term target of at least 10%+.

UMA Trendline Shattered! What’s Next for Bulls?BINANCE:UMAUSDT has broken above the key trendline resistance and is now testing a minor resistance zone.
If a candle closes decisively above this marked zone, we could see a parabolic upside move in the coming sessions.
This breakout structure, paired with strong momentum, makes it a setup worth

#UMA/USDT#UMA
The price is moving within a descending channel on the 1-hour frame, adhering well to it, and is heading for a strong breakout and retest.
We are seeing a bounce from the lower boundary of the descending channel, which is support at 1.36.
We have a downtrend on the RSI indicator that is abou

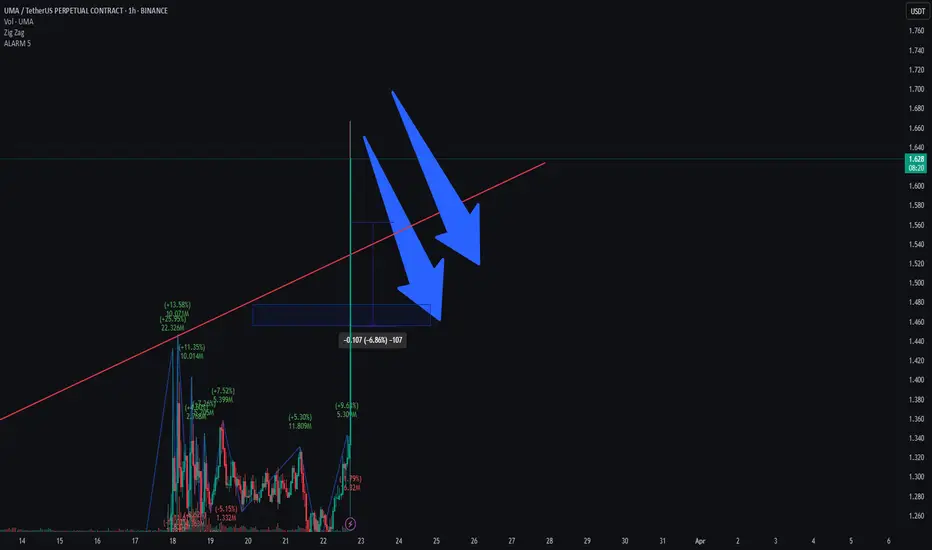
Is UMA Losing Strength?This is a very short-term trade setup, but keep in mind that TradingView isn’t favorable toward analyses below the 1-hour timeframe.
It appears that the 1-5 impulse wave has completed, and a pullback is likely to begin soon.
Traders should be cautious and look for confirmation before entering. 📉🔍
See all ideas
Summarizing what the indicators are suggesting.
Oscillators
Neutral
SellBuy
Strong sellStrong buy
Strong sellSellNeutralBuyStrong buy
Oscillators
Neutral
SellBuy
Strong sellStrong buy
Strong sellSellNeutralBuyStrong buy
Summary
Neutral
SellBuy
Strong sellStrong buy
Strong sellSellNeutralBuyStrong buy
Summary
Neutral
SellBuy
Strong sellStrong buy
Strong sellSellNeutralBuyStrong buy
Summary
Neutral
SellBuy
Strong sellStrong buy
Strong sellSellNeutralBuyStrong buy
Moving Averages
Neutral
SellBuy
Strong sellStrong buy
Strong sellSellNeutralBuyStrong buy
Moving Averages
Neutral
SellBuy
Strong sellStrong buy
Strong sellSellNeutralBuyStrong buy
Displays a symbol's price movements over previous years to identify recurring trends.
Frequently Asked Questions
The current price of UMA / TetherUS (UMA) is 1.340 USDT — it has fallen −1.82% in the past 24 hours. Try placing this info into the context by checking out what coins are also gaining and losing at the moment and seeing UMA price chart.
UMA / TetherUS price has fallen by −26.83% over the last week, its month performance shows a 15.76% increase, and as for the last year, UMA / TetherUS has decreased by −44.81%. See more dynamics on UMA price chart.
Keep track of coins' changes with our Crypto Coins Heatmap.
Keep track of coins' changes with our Crypto Coins Heatmap.
UMA / TetherUS (UMA) reached its highest price on Feb 4, 2021 — it amounted to 43.998 USDT. Find more insights on the UMA price chart.
See the list of crypto gainers and choose what best fits your strategy.
See the list of crypto gainers and choose what best fits your strategy.
UMA / TetherUS (UMA) reached the lowest price of 0.888 USDT on Apr 7, 2025. View more UMA / TetherUS dynamics on the price chart.
See the list of crypto losers to find unexpected opportunities.
See the list of crypto losers to find unexpected opportunities.
The safest choice when buying UMA is to go to a well-known crypto exchange. Some of the popular names are Binance, Coinbase, Kraken. But you'll have to find a reliable broker and create an account first. You can trade UMA right from TradingView charts — just choose a broker and connect to your account.
Crypto markets are famous for their volatility, so one should study all the available stats before adding crypto assets to their portfolio. Very often it's technical analysis that comes in handy. We prepared technical ratings for UMA / TetherUS (UMA): today its technical analysis shows the buy signal, and according to the 1 week rating UMA shows the sell signal. And you'd better dig deeper and study 1 month rating too — it's sell. Find inspiration in UMA / TetherUS trading ideas and keep track of what's moving crypto markets with our crypto news feed.
UMA / TetherUS (UMA) is just as reliable as any other crypto asset — this corner of the world market is highly volatile. Today, for instance, UMA / TetherUS is estimated as 5.28% volatile. The only thing it means is that you must prepare and examine all available information before making a decision. And if you're not sure about UMA / TetherUS, you can find more inspiration in our curated watchlists.
You can discuss UMA / TetherUS (UMA) with other users in our public chats, Minds or in the comments to Ideas.