UMAUSDT.P trade ideas

#Uma/USDT#Uma
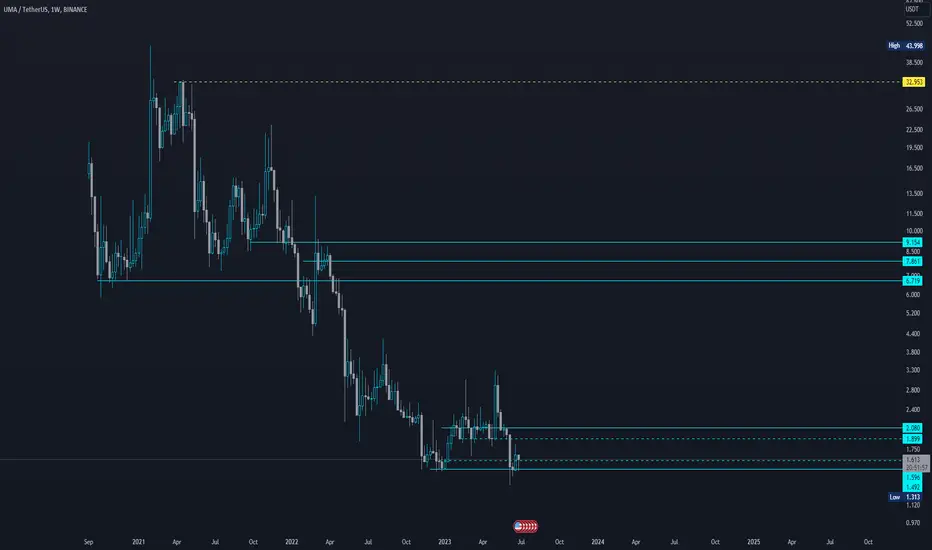
The bearish channel on the daily frame has been broken
Now the downward trend is being tested again
The price is expected to rise again from the entry areas marked on the chart
About the price of 1.410
With a goal of 2.44
Nearly 200% expected rise
Supported by Bitcoin's bullish movement

UMAUSDTumausdt currency
This currency has had an upward impact with the start of Bitcoin movement
tp 2.356

#UMA/USDT - Long - Potential 19.37%Strategy: Long
Exchange: BINANCE
Account: Spot
Entry mode: Market order in range
Invest: 2.5%
Exit:
⎿ Target 2 : 2.456
⎿ Target 1 : 2.282
Entry: 2.090
Stop: 1.752
Active breakout with volume.

UMAUSDT"As we enter the bullish season, the initial target to aim for is
target : 28 🎯.
This is based on a combination of technical analysis indicators and market trends.
However, it's important to approach trading with caution and adapt to changing market
conditions.
Keep an eye on key support and resistance levels, as well as any significant news or events that may impact the market.
Remember to use proper risk management techniques and consider setting profit targets along the way.
Happy trading!"

✴️ UMA Towards 8.888 (353% Growth Potential Within 1-3 Months) UMA has undergone one of the longest consolidation phase ever, moving sideways since May 2022.
The bulls have been exposed by the charts:
UMAUSDT is trading above its June 2022 low (A major bullish development).
UMAUSDT is trading daily above MA200 after a high volume breakout.
Bullish accumulation has been happening for years.
Recent bottom hit followed by strong bullish action.
Bitcoin and other major Altcoins all strongly bullish.
Tether Dominance bearish.
When Tether Dominance (USDT.D) goes bearish, money flows from stablecoins to Crypto (Bitcoin + Altcoins).
MA200 denotes the long-term potential for this and other pairs.
Trading above this level, fully confirmed, signals that we can experience long-term growth, higher highs and higher, higher, higher for years to come.
Namaste.

$UMA Bullish Dragon / Broadening BottomA common look for macro reversals in this market. UMA looks to be at an early stage here.
In the context of the 3day bullish dragon we would be looking for a break of the supply line, and and an impulsive move to the "hump" or last point of supply. Above that confirms the breakout of the dragon, and essentially, the local double bottom. That might be an area would could also anticipate a pullback, maybe for a checkback of 2.45 to test support.
Above that would be 4.23 which is the overhead resistance of the right angled and descending broadening formation. This is also a zone we'd expect to see a pullback and usually a high and tight consolidation which ultimately gives you a partial decline if / when it retests the 4.23 level.
6.56 above that would be the measured move of the local double bottom which is right around the local 1.618 extension at 6.02, then 11.20 at the 618 would be the major dragon target, with the measured move of the broadening formation at 14.88, and 16 at the 2.618

UMA/USDT WHAT NEXT? 👀 UMA Today analysis💎 Paradisers, brace yourselves for a promising prospect with UMAUSDT, currently positioned in a demand zone and poised for potential moves.
💎 In our past observations, UMA broke free from its descending channel, embarking on an upward journey. However, it faced resistance at the 1.810 mark. Presently, as it navigates the demand zone, we foresee two potential outcomes.
💎 The first scenario could see it riding a bullish wave from the 1.438 demand level, aiming to challenge the robust resistance once again. Alternatively, should it dip below the demand zone, we might witness a retest of the crucial 1.233 support level.
💎 Remember to employ prudent trading strategies and use proper stop-loss measures! Stay alert to market movements and look forward to more insight

UMA at Daily resistance UMA at daily resistance currently but I will advice we wait for daily bearish OB above before taking short….
Follow for more market update
Can chat me up for market update


UMAUSDT (1H) - Bearish breakoutHi Traders
UMAUSDT (1H Timeframe)
The market is in a downtrend, and we are waiting for an entry signal to go SHORT below the 1.4740 support level. Only the upward break of 1.5570 would cancel the bearish scenario.
Trade details
Entry: 1.4740
Stop loss: 1.5570
Take profit 1: 1.4227
Take profit 2: 1.3397
Score: 8
Strategy: Bearish breakout

UMA LOOKS BULLISHHi, dear traders. how are you ? Today we have a viewpoint to BUY/LONG the UMA symbol.
For risk management, please don't forget stop loss and capital management
When we reach the first target, save some profit and then change the stop to entry
Comment if you have any questions
Thank You

uma getting ready for massive bullish rally Seems Like Getting Ready For Solid Recovery Formed Descending Channel in 3 days Tf Incase Of Breakout Expecting Massive bullish Rally In Coming Weeks Expecting 250 to 280% Bullish Move Incase Of Successful Breakout Keep Eyes On Lower Tfs Too For Buying Opportunities

UMA token formed bullish Gartley for upto 10% pumpHi dear friends, hope you are well and welcome to the new trade setup of UMA token with US Dollar pair.
Previously we caught almost 65% pump of UMA as below:
Now on a 4-hr frame, UMA has formed a bullish Gartley move for the next price reversal.
Note: Above idea is for educational purpose only. It is advised to diversify and strictly follow the stop loss, and don't get stuck with trade.

Bar pattern flipped, 60% upside by Aug 8thI mapped a bar pattern over the first bottom, then flipped and stretched it to match the possible second bottom with bullish divergence on the RSI. It indicates we can spike up and return to these levels before hitting the 60% target on Aug 8th.

UMA would be crazysee how they play it, crypto long terrm is boring to chart since all of it looks similarr being down so far.
Two Harmonic Cross Road completes at shifter rally. OKX:UMAUSDT.P
Two Harmonic Cross Road completes at shifter rally.
Let's be ready for the level that we desire to have a short position.
Good Luck Everyone.
May the force be with you!

UMAUSDT (1H) - Bullish reversalHi Traders
UMAUSDT (1H Timeframe)
Waiting for the upward break of the 1.946 resistance level, which will complete a bullish trend reversal pattern to go LONG. Only the downward break of 1.896 would cancel the bullish scenario.
Trade details
Entry: 1.946
Stop loss: 1.896
Take profit 1: 1.977
Take profit 2: 2.027
Score: 7
Strategy: Bullish reversal

🔥 UMA Bullish Channel: Highest Risk Reward Trade Of The DayUMA has been trading inside this bullish channel for over 6 months now. This trade is based on the idea that UMA will continue to trade within the channel.
Keep in mind that BTC is currently in a short-term bearish trend, so a long-entry carries more risk from the start. To counter this, this particular trade has a very high risk reward ratio of 15.5
More defensive traders could take the safer trade with a lower SL and a slightly lower entry. Still, a risk-reward ratio of 10.53 is very good.


UMA token forming bullish Gartley for upto 35% pumpHi dear friends, hope you are well and welcome to the new trade setup of UMA token with US Dollar pair.
Recently we caught more than 66% pump of UMA a below:
Now on a 4-hr time frame, UMA has formed a bullish Gartley pattern for the next price reversal.
Note: Above idea is for educational purpose only. It is advised to diversify and strictly follow the stop loss, and don't get stuck with trade

UMA Coin Price Prediction✅ UMA COIN PRICE ✅
🔥 Price has just broken the daily resistance and now price is in momentum🔥
I am looking at 2 levels ..
🚀We have 2 opportunities to make 15% gains on each🚀
👉 Follow me for more opportunities.

UMA Looks ready!!!!Uma once it breaks from this trendline is going to do an explosive move.
If you have any questions just dm me.
Position yourself and manage your risk accordingly.
Personally, I only do spot trading and having been making good gains.
