#UMA/USDT#UMA
The price is moving within a descending channel on the 1-hour frame, adhering well to it, and is heading for a strong breakout and retest.
We are seeing a bounce from the lower boundary of the descending channel, which is support at 1.36.
We have a downtrend on the RSI indicator that is abou

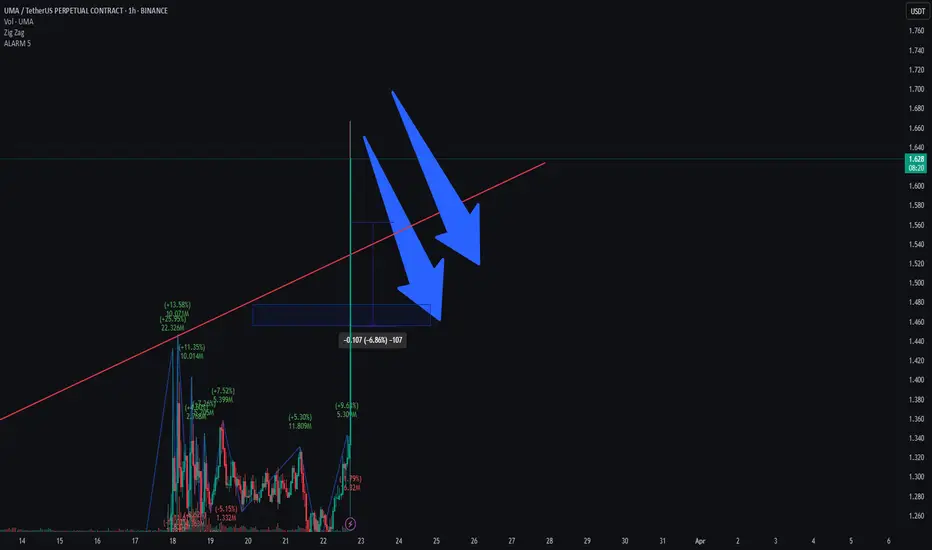
Is UMA Losing Strength?This is a very short-term trade setup, but keep in mind that TradingView isn’t favorable toward analyses below the 1-hour timeframe.
It appears that the 1-5 impulse wave has completed, and a pullback is likely to begin soon.
Traders should be cautious and look for confirmation before entering. 📉🔍
UMAUSDT – Critical Level at 1.278!UMAUSDT – Critical Level at 1.278! 🚨
“If 1.278 breaks, we’re flipping bearish—and we won’t hesitate to short!”
🔥 Key Insights:
✅ 1.278 = Make-or-Break Level – Holding = bullish continuation, breaking = serious trouble.
✅ First Retest = High-Probability Short Zone – If we break, we wait for confir

UMA/USDT: Confirmed Breakout – Is a Major Rally Ahead?🔹 Confirmed Downtrend Breakout & Retest:
UMA has successfully broken out of its long-term downtrend and is now retesting its breakout zone, confirming strong support for a potential rally.
🔹 Descending Channel Support & Reversal Zone:
The price is trading near the lower boundary of a descending

UMA shorting idea with 7-starMarket is down? You don't have to worry about entering a trade. Introducing our new feature of Special Future sell.
DYOR
For indicator access, you can drop a message.

UMAUSDT SHORT!!!!#UMA/USDT
Entry zone : 1.73864 - 1.694752
Targets : 1.679475 - 1.645546 - 1.611618 - 1.577689 - 1.543760 - 1.509831 - 1.475902 - 1.441974
Stop loss :1.80616

umausdtIt is likely forming a **flag pattern**, and considering the number of touches to the **channel’s support and resistance**, we have a potential setup in mind.

UMA/USDTKey Level Zone: 1.710 - 1.750
HMT v5 detected. The setup looks promising, supported by a previous upward/downward trend with increasing volume and momentum, presenting an excellent reward-to-risk opportunity.
HMT (High Momentum Trending):
HMT is based on trend, momentum, volume, and market structu

UMAUSDT 1WUMA ~ 1W Analysis
#UMA This is the lowest support for now. Buy from here if you still have a Conviction on this coin with a minimum target of 20+

UMA ANALYSIS📊 #UMA Analysis : Update
✅As we said earlier, #UMA performed same. Around 80% move done in #UMA. There was a formation of Descending Channel Pattern on weekly chart with a breakout🧐
Current we can see a little retest and then we could target for next resistance
👀Current Price: $2.890
🚀 Target Pr

See all ideas
Displays a symbol's price movements over previous years to identify recurring trends.
Related pairs
Frequently Asked Questions
UMA / Tether (UMA) reached its highest price on Jan 10, 2021 — it amounted to 79.82479 USDT. Find more insights on the UMA price chart.
See the list of crypto gainers and choose what best fits your strategy.
See the list of crypto gainers and choose what best fits your strategy.
UMA / Tether (UMA) reached the lowest price of 0.30167 USDT on Feb 4, 2025. View more UMA / Tether dynamics on the price chart.
See the list of crypto losers to find unexpected opportunities.
See the list of crypto losers to find unexpected opportunities.
The safest choice when buying UMA is to go to a well-known crypto exchange. Some of the popular names are Binance, Coinbase, Kraken. But you'll have to find a reliable broker and create an account first. You can trade UMA right from TradingView charts — just choose a broker and connect to your account.
You can discuss UMA / Tether (UMA) with other users in our public chats, Minds or in the comments to Ideas.