#UMA/USDT#UMA
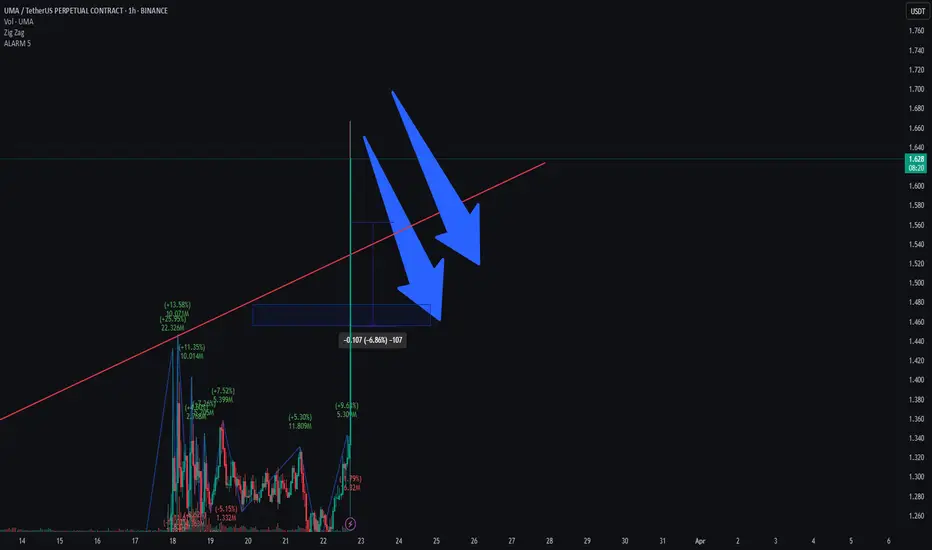
The price is moving within a descending channel on the 1-hour frame, adhering well to it, and is heading for a strong breakout and retest.
We are seeing a bounce from the lower boundary of the descending channel, which is support at 1.36.
We have a downtrend on the RSI indicator that is about to break and retest, supporting the upward trend.
We are looking for stability above the 100 moving average.
Entry price: 1.39
First target: 1.42
Second target: 1.45
Third target: 1.49
UMAUSDT trade ideas

Is UMA Losing Strength?This is a very short-term trade setup, but keep in mind that TradingView isn’t favorable toward analyses below the 1-hour timeframe.
It appears that the 1-5 impulse wave has completed, and a pullback is likely to begin soon.
Traders should be cautious and look for confirmation before entering. 📉🔍
UMAUSDT – Critical Level at 1.278!UMAUSDT – Critical Level at 1.278! 🚨
“If 1.278 breaks, we’re flipping bearish—and we won’t hesitate to short!”
🔥 Key Insights:
✅ 1.278 = Make-or-Break Level – Holding = bullish continuation, breaking = serious trouble.
✅ First Retest = High-Probability Short Zone – If we break, we wait for confirmation.
✅ Aggressive Approach? Direct Short on Breakdown – For those who love momentum plays.
💡 The Game Plan:
If 1.278 Holds – We Stay Bullish – No reason to fight the trend.
If 1.278 Breaks – Short on Retest or Directly – We trade what we see, not what we hope.
CDV & Volume Profile Must Confirm Weakness – If buyers disappear, we attack.
“Markets don’t lie—if this level gives way, we strike without hesitation!” 🚨🔥📉
A tiny part of my runners;
💼 STMXUSDT: 2 Buying Areas
🐢 TURBOUSDT: Buy Zones and Buyer Presence
🌍 ICPUSDT.P: Massive Upside Potential | Check the Trade Update For Seeing Results
🟠 IDEXUSDT: Spot Buy Area | %26 Profit if You Trade with MSB
📌 USUALUSDT: Buyers Are Active + %70 Profit in Total
🌟 FORTHUSDT: Sniper Entry +%26 Reaction
🐳 QKCUSDT: Sniper Entry +%57 Reaction

UMA/USDT: Confirmed Breakout – Is a Major Rally Ahead?🔹 Confirmed Downtrend Breakout & Retest:
UMA has successfully broken out of its long-term downtrend and is now retesting its breakout zone, confirming strong support for a potential rally.
🔹 Descending Channel Support & Reversal Zone:
The price is trading near the lower boundary of a descending channel, a critical area that could act as a launchpad for upward movement.
🔹 MACD Bullish Divergence:
A potential bullish crossover on the MACD suggests a shift in momentum to the upside.
🔹 Historical Explosive Moves (325% & 125% Gains):
Previous breakouts from similar setups have led to major surges. If this pattern holds, UMA could be poised for another strong move.
🔹 RSI Rebounding from Oversold Levels:
The RSI indicator is showing signs of strength, indicating that the asset is in a favorable accumulation zone.
📍 Target Price Levels (TP):
🎯 2.231
🎯 3.077
🎯 4.242
🎯 5.674
🎯 7.337
🎯 10.000 (Final target)
📉 Current Entry Zone: $1.42 - $1.49
📌 Trade Setup Summary:
✔ Breakout Confirmed
🔄 Retest in Progress
📈 Bullish Indicators Aligning
🎯 Potential Upside Targets Set
🚨 Disclaimer: This analysis is for educational purposes only and should not be considered financial advice. Always conduct your own research before making any investment decisions.

UMA shorting idea with 7-starMarket is down? You don't have to worry about entering a trade. Introducing our new feature of Special Future sell.
DYOR
For indicator access, you can drop a message.

UMAUSDT SHORT!!!!#UMA/USDT
Entry zone : 1.73864 - 1.694752
Targets : 1.679475 - 1.645546 - 1.611618 - 1.577689 - 1.543760 - 1.509831 - 1.475902 - 1.441974
Stop loss :1.80616

umausdtIt is likely forming a **flag pattern**, and considering the number of touches to the **channel’s support and resistance**, we have a potential setup in mind.

UMA/USDTKey Level Zone: 1.710 - 1.750
HMT v5 detected. The setup looks promising, supported by a previous upward/downward trend with increasing volume and momentum, presenting an excellent reward-to-risk opportunity.
HMT (High Momentum Trending):
HMT is based on trend, momentum, volume, and market structure across multiple timeframes. It highlights setups with strong potential for upward movement and higher rewards.
Whenever I spot a signal for my own trading, I’ll share it. Please note that conducting a comprehensive analysis on a single timeframe chart can be quite challenging and sometimes confusing. I appreciate your understanding of the effort involved.
Important Note :
Role of Key Levels:
- These zones are critical for analyzing price trends. If the key level zone holds, the price may continue trending in the expected direction. However, momentum may increase or decrease based on subsequent patterns.
- Breakouts: If the key level zone breaks, it signals a stop-out. For reversal traders, this presents an opportunity to consider switching direction, as the price often retests these zones, which may act as strong support-turned-resistance (or vice versa).
My Trading Rules
Risk Management
- Maximum risk per trade: 2.5%.
- Leverage: 5x.
Exit Strategy
Profit-Taking:
- Sell at least 70% on the 3rd wave up (LTF Wave 5).
- Typically, sell 50% during a high-volume spike.
- Adjust stop-loss to breakeven once the trade achieves a 1.5:1 reward-to-risk ratio.
- If the market shows signs of losing momentum or divergence, ill will exit at breakeven.
The market is highly dynamic and constantly changing. HMT signals and target profit (TP) levels are based on the current price and movement, but market conditions can shift instantly, so it is crucial to remain adaptable and follow the market's movement.
If you find this signal/analysis meaningful, kindly like and share it.
Thank you for your support~
Sharing this with love!
HMT v2.0:
- Major update to the Momentum indicator
- Reduced false signals from inaccurate momentum detection
- New screener with improved accuracy and fewer signals
HMT v3.0:
- Added liquidity factor to enhance trend continuation
- Improved potential for momentum-based plays
- Increased winning probability by reducing entries during peaks
HMT v3.1:
- Enhanced entry confirmation for improved reward-to-risk ratios
HMT v4.0:
- Incorporated buying and selling pressure in lower timeframes to enhance the probability of trending moves while optimizing entry timing and scaling
HMT v4.1:
- Enhanced take-profit (TP) target by incorporating market structure analysis
HMT v5 :
Date: 23/01/2025
- Refined wave analysis for trending conditions
- Incorporated lower timeframe (LTF) momentum to strengthen trend reliability
- Re-aligned and re-balanced entry conditions for improved accuracy

UMAUSDT 1WUMA ~ 1W Analysis
#UMA This is the lowest support for now. Buy from here if you still have a Conviction on this coin with a minimum target of 20+

UMA ANALYSIS📊 #UMA Analysis : Update
✅As we said earlier, #UMA performed same. Around 80% move done in #UMA. There was a formation of Descending Channel Pattern on weekly chart with a breakout🧐
Current we can see a little retest and then we could target for next resistance
👀Current Price: $2.890
🚀 Target Price: $3.800
⚡️What to do ?
👀Keep an eye on #UMA price action and volume. We can trade according to the chart and make some profits⚡️⚡️
#UMA #Cryptocurrency #TechnicalAnalysis #DYOR

UMA/USDTKey Level Zone : 3.090 - 3.110
HMT v4.0 detected. The setup looks promising, supported by a previous upward/downward trend with increasing volume and momentum, presenting an excellent reward-to-risk opportunity.
HMT (High Momentum Trending):
HMT is based on trend, momentum, volume, and market structure across multiple timeframes. It highlights setups with strong potential for upward movement and higher rewards.
Whenever I spot a signal for my own trading, I’ll share it. Please note that conducting a comprehensive analysis on a single timeframe chart can be quite challenging and sometimes confusing. I appreciate your understanding of the effort involved.
Important Note :
Role of Key Levels:
- These zones are critical for analyzing price trends. If the key level zone holds, the price may continue trending in the expected direction. However, momentum may increase or decrease based on subsequent patterns.
- Breakouts: If the key level zone breaks, it signals a stop-out. For reversal traders, this presents an opportunity to consider switching direction, as the price often retests these zones, which may act as strong support-turned-resistance (or vice versa).
My Trading Rules
Risk Management
- Maximum risk per trade: 2.5%.
- Leverage: 5x.
Exit Strategy
Profit-Taking:
- Sell at least 70% on the 3rd wave up (LTF Wave 5).
- Typically, sell 50% during a high-volume spike.
- Adjust stop-loss to breakeven once the trade achieves a 1.5:1 reward-to-risk ratio.
- If the market shows signs of losing momentum or divergence, ill will exit at breakeven.
The market is highly dynamic and constantly changing. HMT signals and target profit (TP) levels are based on the current price and movement, but market conditions can shift instantly, so it is crucial to remain adaptable and follow the market's movement.
If you find this signal/analysis meaningful, kindly like and share it.
Thank you for your support~
Sharing this with love!
HMT v2.0:
- Major update to the Momentum indicator
- Reduced false signals from inaccurate momentum detection
- New screener with improved accuracy and fewer signals
HMT v3.0:
- Added liquidity factor to enhance trend continuation
- Improved potential for momentum-based plays
- Increased winning probability by reducing entries during peaks
HMT v3.1:
- Enhanced entry confirmation for improved reward-to-risk ratios
HMT v4.0:
- Incorporated buying and selling pressure in lower timeframes to enhance the probability of trending moves while optimizing entry timing and scaling

UMAUSDT 1WUMA ~ 1W
#UMA retest this support block,. And still continues to maintain its bullish structure. If you still have Conviction on this coin,. This support block will be a good buying place for now.


UMAUSDT Short Setup / Futures TradeBINANCE:UMAUSDT
COINBASE:UMAUSD
📈Which side you pick?
Bull or Bear
Low-risk status: 3x-4x Leverage
Mid-risk status: 5x-8x Leverage
(For beginners, I suggest low risk status)
👾Note: The setup is active but expect the uncertain phase as well. also movement lines drawn to predict future price reactions are relative and approximate.
➡️Entry Area:
Yellow zone
⚡️TP:
3.66
3.53
3.41
3.29
3.13
🔴SL:
4.195
🧐The Alternate scenario:
If the price stabilizes against the direction of the position, below or above the trigger zone, the setup will be canceled.

UMA USDT 300% potential UMA/USDT has a 300% potential upside if it sustains strong support levels and breaks significant resistance zones on the weekly timeframe. Growing adoption of the UMA protocol for decentralized financial contracts, coupled with bullish market sentiment, could drive such exponential growth.

UMA/USDT Based on Weekly Chart$UMA/USDT Based on Weekly Chart
NSE:UMA The chart showcases a Double Bottom formation near the Fibonacci support levels, which is a strong reversal signal.
The trendline support combined with Fibonacci retracement at the 0.618 level indicates solid buying interest and a potential bullish continuation.
The critical support lies at $2.50 - $3.00, which aligns with the trendline and Fibonacci 0.618 retracement level.
Resistance Levels (Targets):
T1: $4.810
T2: $6.529
T3: $7.915

UMA 300% bull flag ??On the above 5 day chart price action has corrected almost 80% over the summer months. Retail traders have capitulated. Now is a good moment to consider a long positions before they FOMO back in.. why?
1) Price action and RSI resistance breakouts.
2) Support on past resistance. Red circles.
3) The bull flag itself forecasts a 300% to $10
Is it possible price action corrects further? Sure.
Is it probable? No
Ww
Type: trade
Risk: you decide
Timeframe for long: 2-3 days
Return: 300%

UMAUSDT | Buy Now, Thank Later | Near Term (4HR)UMAUSDT | Buy Now, Thank Later | Near Term (4HR)
Its Ready to Go.
BTCUSDT | Alts Poised to Explode | Near Term (2H)
MYRIAUSDT | Interested to see where this goes | Mid Term (2D)
Mock Up Price Action for VRA w/ Timeline | Mid Term (3D)
Mock Up Price Action for XCH | Mid Term (12HR)
OGNUSDT | Interested to see where this goes | Mid Term (3D)
Mock Up Price Action for CSPRUSDT | Near/Mid Term (2D)
VIDTUSDT | Interested to see where this goes | Mid Term (3D)
RAREUSDT | Interested to see where this goes | Mid Term (3D)
Mock Up Price Action for ALGOUSDT | Mid Term (12HR)

UMAUSDT 5DUMA ~ 5D
#UMA If you still have Conviction on the coin,. buy in stages from here. with a minimum target of 20%. It is only a matter of time until this resistance line is broken

UMAUSDT | Interested to see where this goes | Mid Term (3D)UMAUSDT | Interested to see where this goes | Mid Term (3D)
Couldn't help but allocate some of my speculative alt funds at these levels
Providing list of top picks ideas below
BTCUSDT | Alts Poised to Explode | Near Term (2H)
MYRIAUSDT | Interested to see where this goes | Mid Term (2D)
Mock Up Price Action for VRA w/ Timeline | Mid Term (3D)
Mock Up Price Action for XCH | Mid Term (12HR)
OGNUSDT | Interested to see where this goes | Mid Term (3D)
Mock Up Price Action for CSPRUSDT | Near/Mid Term (2D)
VIDTUSDT | Interested to see where this goes | Mid Term (3D)
RAREUSDT | Interested to see where this goes | Mid Term (3D)
Mock Up Price Action for ALGOUSDT | Mid Term (12HR)

UMAUSDT 1,370% Just Below The All-Time High (Follow Me!)I see UMAUSDT growing more than 2,000%. I think the final target is around 3,000% or more. Here we are going with a conservative target, still focused on the long-term though.
How are you doing today?
Today is new All-Time High day for Bitcoin; as billions of dollars enters the market, the Altcoins are waking up from a multiple months long slumber. They've been consolidating, sideways, since August and looking good. It is still early on most of our favorite pairs.
We focus on the Altcoins because the potential for growth is higher. Growth potential is higher because these projects are newer and smaller and can expand more.
Everybody knows Bitcoin. Everybody holds Bitcoin. We love Bitcoin but Bitcoin is now whale zone. The whales trade Bitcoin with billions of dollars and the price is really high at $80K. These Altcoins are trading near their All-Time Lows and you can't go lower than the lowest; from the bottom we grow.
UMAUSDT is not trading at a true bottom but still relatively low. Low enough to spare us from any surprise down-moves; low enough to allow for massive growth.
I am buying and holding.
You should buy and hold.
The future is bright for Crypto.
The banks are scared and they shouldn't be. They should just welcome Crypto as the evolution of finance. Create a Crypto department and up go we go.
We are all flexible. We are young, we are old.
We can use cash, crypto, gold and fiat; the more the better.
There is no need to fight. There is enough for everyone... We are all one.
Love life.
Life is love.
Namaste.

UMA deserves more credit and hypeCurrent largest prediction market (Polymarket) is powered by UMA and nobody talks about this. To me this is crazy because without hype price doesn't reflect the importance of this project.
The support has been established, I think we only need a spotlight!
Weekly:
When/If people will realize how well UMA works this should gain traction and pump pretty well!
I have a bag of this.
Good luck

UMAUSDTNSE:UMA ~ 5D
#UMA If you still have Conviction on this coin, buy gradually on this support block. Minimum target 20%++
