UMAUSDT - DailyUMA on the daily chart; it seems we have a double bottom and set a daily higher low
There's a possibility that now we will search for a daily lower high and create a tight range..
For every new follower i will add a new idea :)
UMAUSDT trade ideas

UMAUSDT Projection!Here is my new system for my followers. I often get asked directly where to enter and where to exit. From today my charts will be displayed as above. As with all trading, probability plays a huge factor and other variables further decide where the price will go. I never truly know! This system looks for price overlap or equilibrium, the yellow boxes. Mixed with a quick RSI and a MACD with standard settings displayed as bars: green for up, purple for down, and gray for undecided, plus price inside channel above the 21 and 50 EMA. I hope this will help you swing trade and gain some profit. Good luck!

UMAUSDT DAILY 3/14/2021HI GUYS.watch this if u don't wanna miss uma profit.MACD and RSI signal,big triangle,price above EMA20 .I think it can go to 52 very soon.It's the triangle target.Don't miss it

WHAT IF this is a cup&handle?Up until recently UMA was in a never ending descending wedge, at least until 7th March when it broke out. Subsequently it went down following the market but now I've just noticed that what has formed between the last peak into the wedge and the peak of the broke out it's a cup and the handle is currently being "finished".
Statistically handles start going up after retracing around 20% (like this one, you can see it on my chart), afterward they reach the cup border again and from there the real pump begins. Also, using Fib retracement I noticed that we're close to 0.618 line, an important zone for reversals.
If I'm right this is a perfect moment to enter, the target is on the chart. I'd add that I'm convinced that 45$ should be the minimum we should target for this token. This project is the best one for synthetic tokens (if you don't know check it out).
If you have a lot of money and you don't need to do short trades I suggest you to hold this one as long term although the perfect entrace was before the huge pump which then retraced into the falling wedge.
Stop loss: 20.57$


We need more volumeSo, this can be a break out but if volume doesn't increase overnight (I'm in europe) we won't see any pump. The problem is always with UMA: amazing project but poor marketing.
Volume profile shows the price is slightly over the price at which there were most buys, from here we should only go up.
The problem with UMA is that, as I said, people doesn't understand how good is this project so as soon as they reach a little profit they're happy and sell. I think 45€ is the minimum target here.
Try to share info about UMA because if it'll takes off it'll go pretty high!
If price goes back into the wedge you can close the position
UMAUSDT BreakoutTrendline breakout.
We are not registered or licensed in any jurisdiction whatsoever to provide investing advice or anything of an advisory or consultancy nature.
and are therefore are unqualified to give investment recommendations.
Always do your own research and consult with a licensed investment professional before investing.
This communication is never to be used as the basis of making investment decisions, and it is for entertainment purposes only.


How Profitable Is UMA's Recovery?After reaching the important support level between $18-$20, UMA started rebounding. Let’s see how much potential profit UMA could bring us if we bought in now!
Backstory: UMA’s previous strong growth was mainly due to an announcement regarding the arrival of the uSTONKS synthetic token. uSTONKS tracks an index consisting of ten stocks that are most commented on r/wallstreetbets. Wallstreetbets is a Reddit that gained popularity after pumping certain stocks (such as GME and AMC), making hedge funds lose billions of dollars in a short squeeze.
Recovery and Potential Profit
When the hype regarding uSTONKS started to die down, UMA’s price began descending. The price eventually reached $17, or 60% lower than the all-time high. Since then, the token has consolidated for a while, and now it looks like it is trying to start a new uptrend.
If UMA were to recover to its all-time high, it would mean a 110% increase in price, which would essentially more than double your funds if you were to invest now. A minor resistance on its way to a full recovery is the $24 price point. Breaking above $24 significantly would probably mean that UMA is attempting to reach its all-time high again.
Uncorrelated: One excellent aspect about UMA is that it is not as influenced by Bitcoin as the rest of the market. For example, when Bitcoin was trending strongly in October and November 2020, UMA wasn’t moving much. The token made its most substantial moves when it had positive news.
Disclaimer: We do not give trading recommendations; we only break down potential trades. Always do your own research before entering any position.

UMAThis is not a financial advice. Always do your own research and always put stoploss in your trade (SL) :) If you want more detailed info how to study and read charts or just need help with some coin, just write to me here personal message, i will try to answer to everybody... i can help you :) all for free, don't worry, BE HAPPY!
If u like the analysis, please feel free to ask any question about this TA or crypto or any coin and also leave a comment or like or share the idea, i really appreciate it because then my work makes sense :) thanks!

UMAUSDT (UMA) - POTENTIAL BUY ENTRY ANALYSIS 🔎
- UMAUSDT brokeout above the horizontal resistance level and hit an ATH
- Price then retraced for a retest of the flip horizontal support and 0.618 fibonacci retracement level.
- RSI is printing a bullish divergence signal (BDS 🔼).
- The retracement is bounded in the falling wedge pattern.
- A falling wedge pattern is a bullish reversal pattern.
- A breakout above the falling wedge's resistance could be an uptrend continuation signal.
- Price action is printing a double bottom pattern at the retest area.
- A double bottom pattern is a bullish reversal pattern.
- There's a breakout potential.
BUY ENTRY ⬆️
- Breakout above the falling wedge's resistance.
TARGETS 🎯
- Horizontal resistance level (R1).
- Horizontal resistance level (R2).
- Fibonacci extension levels.
SETUP INVALIDATION ❌
-Breakdown below the double bottom horizontal support level.


Do you like money? Good because UMA is here for 600% PUMP!!!UMA is poised to make a massive leg up, causing up to 600% increase in price.
I will be updating the chart as more price action happens, but at this point, I can see the following price targets:
$60
$86
$112
$138
Margin trading not recommended. As UMA can retrace more. But I STRONGLY recommend you to start accumulating, placing your ladder buys from here onwards.
Good luck gentlemen, may the gods of DEFI bless ya! ;)

Possible double bottom on UMASo, market has been in disarray recently and I couldn't exit my trades before the dump so I'm stuck but maybe you guys can do something so I'm still sharing my TA.
This looks a lot like a double bottom (bullish), so unless that green candle that pierces very little from that first top invalidates this pattern, this whould go up. Neckline is the dashed line, if a candlestick closes over that line might me the confirmation this is going up, you might play this in two ways:
- wait for the price to go over the neckline and then enter. REMEMBER, very often price retests the neckline or goes a bit lower;
- enter now
It's up to you. I'm in until 45 (at least)


🆓UMA/USDT Analysis (24/2) #UMA $UMAThere is good buying force at 20$ zone and now it is heading to 30$ zone, this zone is very strong so I think it will take us some days to break through this zone to move up to re-test the ATH at 42$ zone
📈BUY
-Buy: 20-21$. SL if B
-Buy: 29-30$ if A. SL if B
📉SELL
-Sell: 29-30$. SL if A
-Sell: 41-43$. SL if A
♻️BACK-UP
-Sell: 20-21$ if B. SL if A
-Buy: 15.5-16.5$. SL if B
❓Details
Condition A : "If 8H candle closes ABOVE this zone"
Condition B : "If 8H candle closes BELOW this zone"

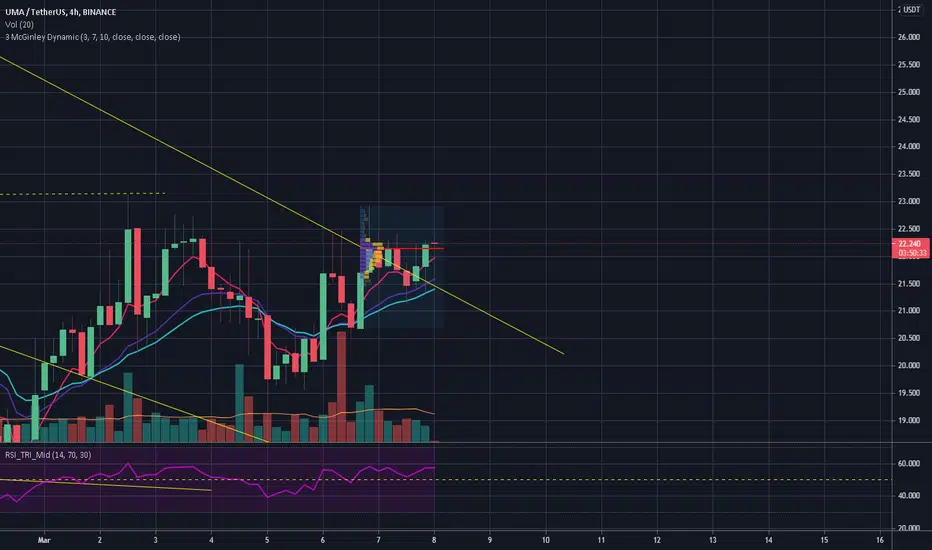
Crypto|UMA/USDT|LongLong UMA/USDT
Activation of the transaction only when the blue zone is fixed/broken.
The author recommends the use of anchoring fixed the blue zone, this variation is less risky.
If there is increased volatility in the market and the price is held for more than 2-3 minutes behind the activation zone after the breakdown, then the activation of the idea occurs at the prices behind the activation zone.
The idea is to work out the resistance level .
* Possible closing of a trade before reaching the take/stop zone. The author can close the deal for subjective reasons, this does not completely cancel the idea and is not a call to the same action, you can continue working out the idea according to your data, but without the support of the author.
+ Maybe right now we will go even lower, then it's okay, the idea is not activated and simply canceled.
The "forecast" tool is used for more noticeable display of % (for the place of the usual % scale) of the price change, I do not put the date and time of the transaction, only %.
Blue zones - activation zones.
Green zones - take zones.
The red zone - stop zone.
Working out the stop when the price returns to the level after activation + fixing in the red zone.
Orange arrow - the direction of take.
Black arrow - neutral scenario without activating the trade.
The red arrow - the direction of the stop.
SUM PNL: This parameter displays the total % of all closed ideas of the "new" format (according to the author) for this sector at the time of publication of the idea. The calculation is very "clumsy" just the sum of the profits of all the ideas, based on this indicator, you can more accurately assess the risks when working with my ideas of this sector. I present you the construction of the idea, you can use it yourself as you like based on your subjective view and risks, the calculation of the PNL indicator is carried out only on transactions that the author closed on TV in manual mode or by take.
P.S Please use RM (risk management) and MM (money management) if you decide to use my ideas, there will always be unprofitable ideas, this will definitely happen, the goal of the system is that there will be more profitable ideas at a distance.

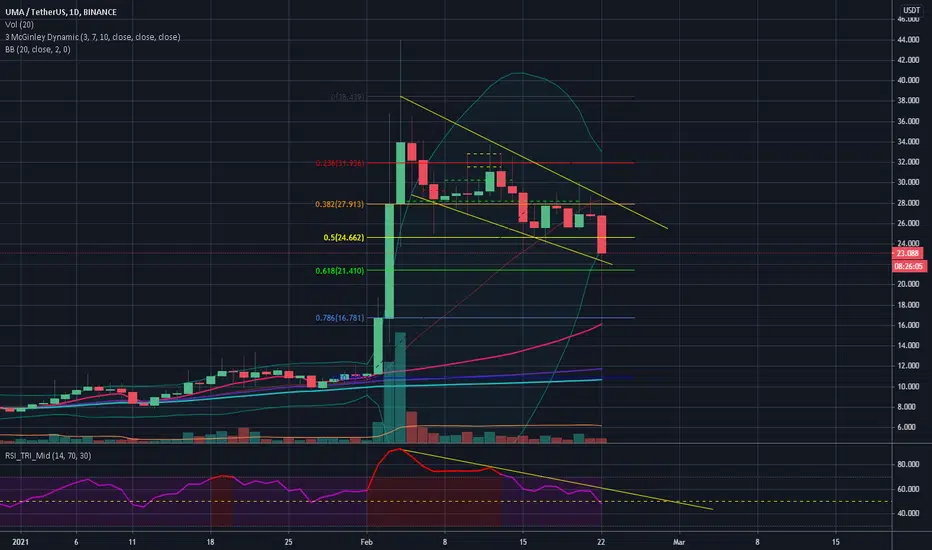
UMA's chart patterns is like the seaSo, I started with bull flag, than a triangle, then a falling wedge and now, today's BTC/market dump changed UMA's pattern into a bigger wedge. Latest breakout is now a LH and we're within 0.5 and 0.618 Fib lines. In my personal experience most of reversal happens in this zone (as I've said in the past I expected a reversal on the falling wedge at 0.5 line. Off course that TA was done according with the former wedge.
Today I've read a tweet of a trader from whom I've much respect and he said most of reversals (in general) happen between 0.618 and 0.786. I personally observed this happening in the precedent zone, I hope I'm right in this case despite him being much better than me in this field.
BB suggests it could revers even now but I took a look at the bigger picture (weekly chart) and I won't rule out a possible price decrease even this week because this current week started today and there's a red candle that could remains red.
Let's see how this thing evolves, if you didn't sell before you should do it now for sure.
Remember my first reasonable target for this is 45$