Support area to create a new upward wave: 8.250-10.867Hello?
Hello traders!
If you "Follow" us, you can always get new information quickly.
Please also click “Boost”.
Have a good day.
-------------------------------------
(UNFIUSDT.P chart)
(1W chart)
To create a new upward wave, it must be supported and rise in the 8.250-10.867 range.
If not, there is a possibility that it will fall to around 5.269.
(1D chart)
In order to rise, support must be found around 8.085-8.724.
If support is confirmed, it is expected to lead to an attempt to rise to around 11.655-12.941.
If it is not supported and falls below 7.786, it may turn into a downward trend, so caution is required.
(1h chart)
The key is whether it can receive support and rise in the 8.839-9.230 range.
If not, the HA-High indicator is expected to decline and be created.
At this time, caution is needed as if there is no support near the HA-High indicator, it is likely to lead to a further decline.
If it continues to decline further, we need to check for support around 8.492.
-------------------------------------------------- -------------------------------------------
** All explanations are for reference only and do not guarantee profit or loss in investment.
** Trading volume is displayed as a candle body based on 10EMA.
How to display (in order from darkest to darkest)
More than 3 times the trading volume of 10EMA > 2.5 times > 2.0 times > 1.25 times > Trading volume below 10EMA
** Even if you know other people’s know-how, it takes a considerable amount of time to make it your own.
** This chart was created using my know-how.
---------------------------------
UNFIUSDT trade ideas

UNFIUSDTUNFIUSDT is in bullish trend.
Currently break the ranging phase.
Made first HH.
We wait and watch for the breakout of last HH.

UNIFI DAO Head and Shoulders on the 4H TF1. H&S on the 4H TF
2. The last candle (beginning at 04:00 UTC) depleted the daily demand zone almost completely.
3. The neckline is at 8.13. if UNIFI tests the neckline a resistance, this is your short signal.
4. The 1H and 4H RSI is close to oversold. Therefore, it could bounce up a little bit.
5. Don’t be hasty. Wait for confirmation.
Trade Idea:
• Entry: 8.13
• SL: 8.58
• Target: 5.75
• R: R: 1:5.26

UNFI at resistanceUNFI had a rejection after breakout and bearish movement will be confirm if the weekly candle fails to close above the resistance line
Do your own analysis to and use good risk management

Where is unfi going?Where I have included $$$, these are liquidity pools.
unfi is collecting all these pools.
After these pools, we have an order block that is both fresh and the origin of the falling movement.
In my opinion, unfi will be rejected and involved in this area, which is the right area for sell/short position.
For risk management, please don't forget stop loss and capital management
When we reach the first target, save some profit and then change the stop to entry
Comment if you have any questions
Thank You

Short UNFIAfter my previous analysis on this coin, which hit the target exactly, this coin has once again reached the golden point, it seems that wave B has been completed and now we should wait for the corrective wave C
this coin is very volatile and risky . I never trade with leverage higher than 1 and observe capital management on such coins

UNFIUNFI long rally will end at last here? Let's see
It's not a financial advise
Always DYOR
Good luck


#UNFI/USDT rejecting from PDH in 4-Hour TF!#UNFI/USDT rejecting from PDH in 4-Hour TF!
NYSE:UNFI looking heavy. Expecting some retracement. A Doji candle is formed too.

Brief Analysis——UNFIRecently, the market sentiment has been flat, and most tokens are mainly fluctuating. Some Alt-coins have seen significant volatility during this time. UNFI is the most volatile token in the past 24 hours. So we choose UNFI as the Token for brief analysis.
UNFI has almost tripled in the past half month. The project Unifi Protocol has no good news recently.
Before this round of gains, UNFI had fell with fluctuation over the past year. Starting from Jul.27, UNFI began to rise. In the initial process, volatility remained at past average levels, and there was also bearish power to hinder the rise. But starting from the end of August, the upward slope suddenly became steeper, pumping like a rocket launching. Bulls dominate.
We can see from the WTA indicator that whale participation is continuity during this round of rise. The situation in the red rectangle is actually no different from the past. But after the red rectangle, there are still whales participating when the price rises, which was not done before. This inflow of fresh whales lasted three rectangle.
From a trading perspective, the current long position in UNFI is more risky than before. If you already hold a long position, then you can continue to pay attention to the WTA indicator. When there are only gray (retail investors), it means the whale may have sneaked away. At that time, the rise may stop, and you may consider taking profits and closing the position.
You can also use the WTA indicator to find those potential tokens, which have obvious whale participation in the early stages of the rise, and still have fresh inflow later.
Disclaimer: Nothing in the script constitutes investment advice. The script objectively expounded the market situation and should not be construed as an offer to sell or an invitation to buy any cryptocurrencies.
Any decisions made based on the information contained in the script are your sole responsibility. Any investments made or to be made shall be with your independent analyses based on your financial situation and objectives.

UNFIUSDTHello Traders,
As we can see after a perfect retest we can expect a perfect pump from here following the chart pattern to open a position.

UNFI/USDT What is The Next Move for UNFI ?? UNFI Today Analysis Yello Paradisers, UNFI Analysis: A Crossroads of Potential Moves
💎UNFI appears poised for rejection at the Bearish Order Block (OB) zone, likely retracing back to the daily demand area.
💎Indicator tools suggest that UNFI is currently overbought and displaying bearish divergence on the daily timeframe, signaling a need for a corrective phase before any further upward movement.
For entry strategies, you have two options:
💎Long Position: Wait for UNFI to successfully break and close above the Bearish OB zone. If this occurs, UNFI is likely to consolidate at this level before resuming its upward trajectory towards the next supply level at $13.5.
💎Short Position: Given that UNFI is in the Bearish OB zone and indicators like overbought conditions and bearish divergence support a short position, you could consider entering a short trade now. Close the position if UNFI breaks above the Bearish OB zone, as this would indicate a potential continuation of upward movement.
Choose your strategy wisely based on these potential scenarios.

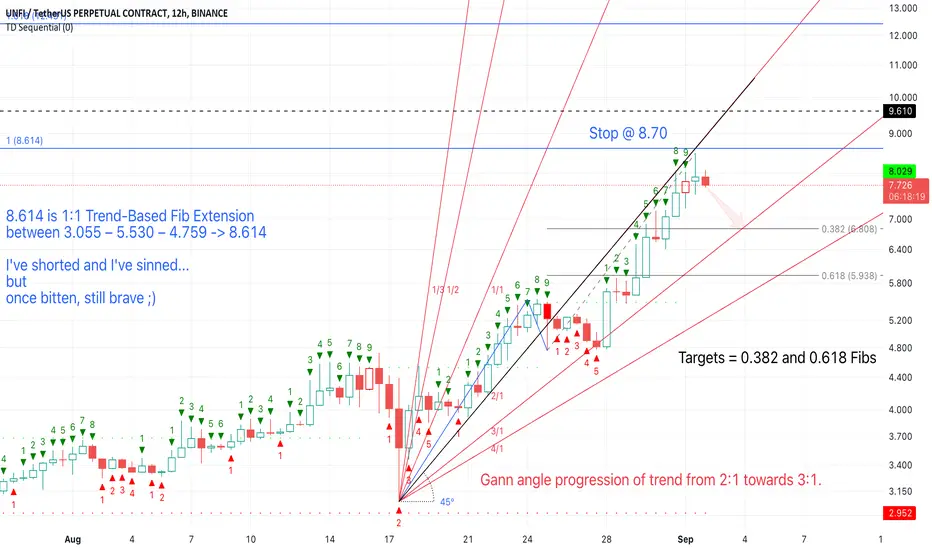
UNFI/USDT I've shorted and I've sinned... but 💪 😎I've shorted and I've sinned...
but
once bitten, still brave ;)
8.614 is 1:1 Trend-Based Fib Extension
between 3.055 – 5.530 – 4.759 -> 8.614
Gann angle progression of trend from 2:1 towards 3:1.
Stop @ 8.70
Targets = 0.382 and 0.618 Fibs, that is 6.81 and 5.94.

Short UNFIthis coin has completed 5 wave and is going to start its first correction wave . the divergence between wave 3 and 5 was shown in the chart


Unfi/Usdt Update | Crypto By Ghazi Unfiusdt
"If we closely observe the overall cryptocurrency market, we'll notice that almost every weekend, one particular coin experiences a significant increase in value. Examples of such coins include STMX, OGN, BLZ, NMR, CYBER, and now UNFI.
I anticipate a decrease in the price of UNFI on Tuesday, followed by another price increase next week, possibly reaching $13.60. I believe $13.60 could be the peak of this UNFI price increase, with a subsequent decline back to the $7-8 range. However, please note that this is just my personal opinion and not financial advice. It's crucial to conduct your own research before making any investment decisions. If you find our insights helpful, we appreciate your support.
Happy trading!"

unfiusdtIf the price goes up, we have a 70% chance that the price will go down within the specified Interprice range.
1 because the data gauge and the uptrend line have been broken
2 MB of data and the last buyers lost to sellers
3 in Pir has reached the supply range
In case of entry, capital management should be followed.

UNFI/USDTUNFI is trading at the resitance level here and with the RSI being overbought, it will take a dip from this point. Right time to short UNFI and make some quick profits

A downward wave is coming...I'm not sure but one of possibilities for UNFIUSDT chart has been shown, and according to this wave counting, a huge downward wave is coming!

Direction of unfi usatUnfi are powerful to be on long,on 4 ht time frame we can see a golden target to 7.00 I, shorts avolable only on lower time frame, only scalping - as shorts.

Don't short crazy Pumps - #UNFIUNFI closed super bullish last month
Currently I can see continuation of the pump until FVG resistance levels that you see on the chart (n.1)
Where either it will reject from 1st FVG or resistance line (blue line that you see on the chart. (n.2)
From current situation ,short i would open only if i see the coin below 7.28$
