UNIUSD.P trade ideas

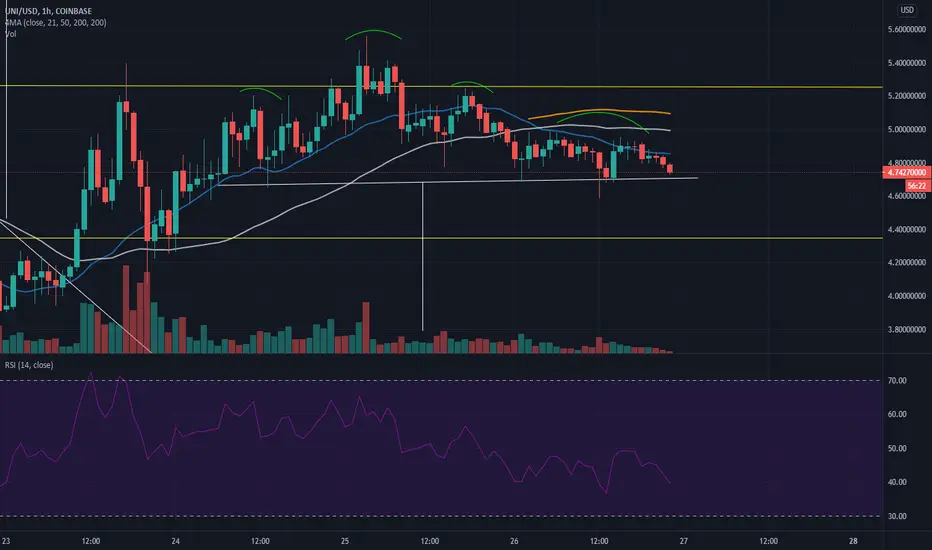
Failed breakout - watch out if THIS level of support breaks The current situation:
1. The price action previously failed to break out of the ascending triangle that was in (see my previous posts) and now it looks bearish as a head and shoulders pattern is more apparent on the 1HR chart. The price action has also broken below the 4HR 21MA and now the moving average that is acting as support is the 6HR 21MA. This is also at about the neckline of the head and shoulders pattern, with a measured target of about 3.8 USD
The bullish case:
1. The price action bounces off the 6HR and retry the resistance at about 5.25 USD
The bearish case:
1. Price action breaks below the 6HR 21MA, under which the next level of support is the 0.786 FIB level at about 4.35 USD
*Let me know in the comment section if you agree or disagree, would love to hear your ideas too.
*These are purely my speculations and not financial advice. You should always do your own due diligence before trading or investing.

UNI'S CLOSING WEDGE at $5Set up the bottom from before Uni was listed on Coinbase. The top is linked to its rise before going parabolic. Also added some fib levels for future support/resistance. Lets see how it shakes out.

Uniswap / Usd - Time to go long?It could be the bottom of the down move (at least in near short term). Waiting for the patterns / break outs, while the candle right here on the support line seems like a good entry sign to buy with great RR ratio, including tight SL. What do you think? I see similar head & shoulders pattern on Dollar index...

Uniswap / Usd - Time to re-entry??I'm about to re-entry for a second bullish wave at this moment. Will it goes up, or the bears gonna win this fight? Nobody knows, but I see potential in this price level - as a possible false break down -, and I can take action here with tight SL again. What do you think? Is there anybody who thinks the same?


UNI PERP LONG NIce continuation to the upside , this one still has some steam to go up but not to all time high.

#UNI waiting waiting on triangle to complete
imo it should breakup cause HTF fibs have held support well
this is my setup for LONG -
In case we reject at red-box will look to short


Wait for it to dump first, UNI (possible set up)Right now we are in a place where people are probably dumping the free uni airdrop, so I won't be entering until we have a clear change of market structure. It could bounce off a decent fib, but I expect a pretty deep continuation at this stage.


UNIUSD LONG***This information is not a recommendation to buy or sell. It is to be used for educational purposes only.***

Failed breakout but another retry looks to be on the wayThe current situation:
1. Yesterday, 9/24, price action attempted to break out of the ascending triangle as shown but had failed and got rejected at about 5.55 USD. Now it has retreated back to the 1HR 50MA at about 5 USD as support and the bottom trend line is now adjusted for a bigger ascending triangle. If price action breaches the 1HR 50MA, the next level of support is the 4HR 21MA followed by the 6HR 21MA.
A complex head and shoulders pattern also apparent on the 1HR chart, so this should be paid attention to in case the bulls do not hold up the price.
Looking at the price action from the 6HR chart, this is still appears to be a bullish setup as price action broke the 21MA and now is retesting it as support. The resistance to break is still the FIB level at about 5.25
*Let me know in the comment section if you agree or disagree, would love to hear your ideas too.
*These are purely my speculations and not financial advice. You should always do your own due diligence before trading or investing.

UNISWAP sentiment - LONGIf price breaks above the 38 fib level (resistance) then we can expect a bullish rally above $7
Price currently sits on the bullish trendline and has been rejected by the 50MA
Feel free to donate if my analysis resonates with you
Goodluck.

UNI/USD Resistance (Targets) & Support LevelsHere we have the UNIUSD support and resistance levels.
This is done by request.
The dotted gray and orange lines on the chart can be used as targets.
Below the current price, we call them support.
Above the current price, we call them resistance.
I hope that helps.
Namaste.

UNI has broken out of its downward channel. Fakeout or upward?Have been following UNI for a hot minute now. This channel has been broken. Will we see an upward movement towards ATH over the weekend into Monday or a crash down? Looking forward to following this one.

Breakout looking more promisingThe current situation:
1. Price action has broken out of the falling wedge and now has formed an ascending triangle subpattern. The measured target of the breakout from the ascending triangle, at about 6.5 USD, is still within the breakout range of the bigger falling wedge, at about 7.3 USD
There is no other moving average acting as overhead resistance at this time as price action is above all moving averages available to show at this time. Therefore, FIB levels (gold lines) are the resistance to be paying attention to in my opinion.
2. RSI is not overbought in any of the hourly timeframes, so there is room to run if price action trends upwards.
*Let me know in the comment section if you agree or disagree, would love to hear your ideas too.
*These are purely my speculations and not financial advice. You should always do your own due diligence before trading or investing.

UNI Moving up to confim rising channelThe 1 and 4 hour chars show UNI moving towards a second local high and confirming the upward channel. Movement in this channel and low gas prices today could take UNI above the channel to confirm continued upward price action. With the recent pile-in to UNI I'd expect high volatility.

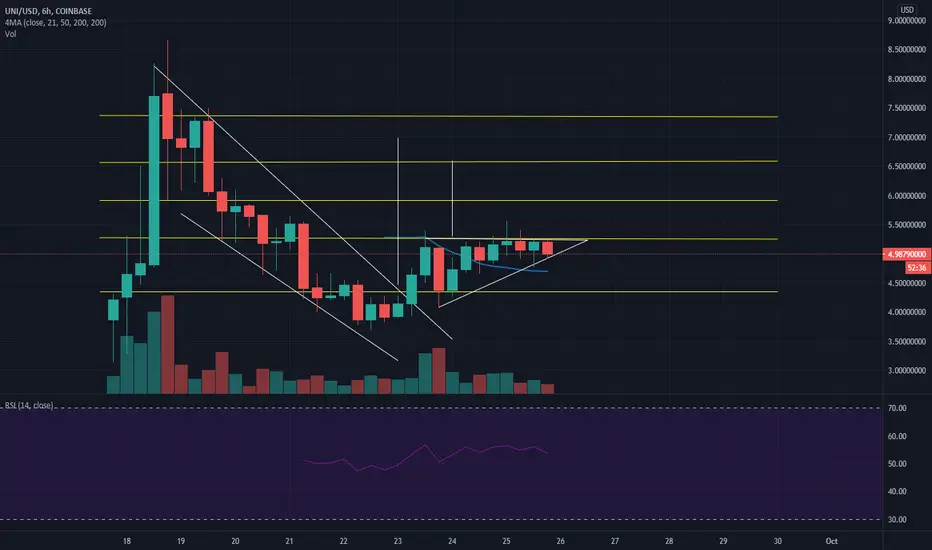
Fakeout or a real reversal to the upside?The current situation:
1. Price action had previously broken out of the falling wedge at about 4.3 USD with the measured target to be about 7 USD. After breaking out, the price action was rejected at the 6HR 21 moving average at about 5.4 USD. It has found support back at the 0.786 FIB level at about 4.3 USD.
There is also a POSSIBLE head and shoulders pattern on the 1HR chart. If the next high does not close above 4.90 USD, that could make the right shoulder and spell bearish action in the short term.
BTC dominance is also trending up, which can signal that altcoins can go lower. However, UNI was possibly one of the few, if not the only altcoin that has made a gain today. But it is still something to be careful of.
2. There was bearish divergence on the 1HR chart preceding the rejection at 5.4 USD and now RSI is in neutral territory on all available timeframes, so price action can go both ways.
The bullish case:
1. Price action needs a solid close above the 6HR 21MA, to make a convincing case it can go higher. The next resistance level above that would be the 0.5 Fib level at about 6 USD.
The bearish case:
1. A close below the 0.786 Fib level would be bad signal for the bulls and can indicate more downside to come as this breakout would not be considered successful.
*Let me know in the comment section if you agree or disagree, would love to hear your ideas too.
*These are purely my speculations and not financial advice. You should always do your own due diligence before trading or investing.

UNIUSD Potential longWe're just filling some fib gaps in boys, if we can consolidate, or see a few more bullish signs, we may be good to green. Stay stacked frens.
