UNIUSD trade ideas


Uniswap Price Analysis — December 31UNI recently suffered a sharp -16% correction from the $20.00 region to the $16.75 support between Monday and Thursday, amid a reemergence of bears across the broader market. Despite the recent crash, the cryptocurrency maintains a bullish outlook on my daily chart and remains on course to $21.50. That said, I expect to see a steady recovery towards the $20.00 psychological resistance mark over the coming days. Nonetheless, this recovery could take a while, given the current volume drought in the market as we head into the new year.
Meanwhile, my resistance levels are $18.25, $19.20, and $20.00, and my support levels are $16.75, $15.00, and $14.00.
Total Market Capitalization: $2.21 trillion
Uniswap Market Capitalization: $11.2 billion
Uniswap Dominance: 0.50%
Market Rank: #18

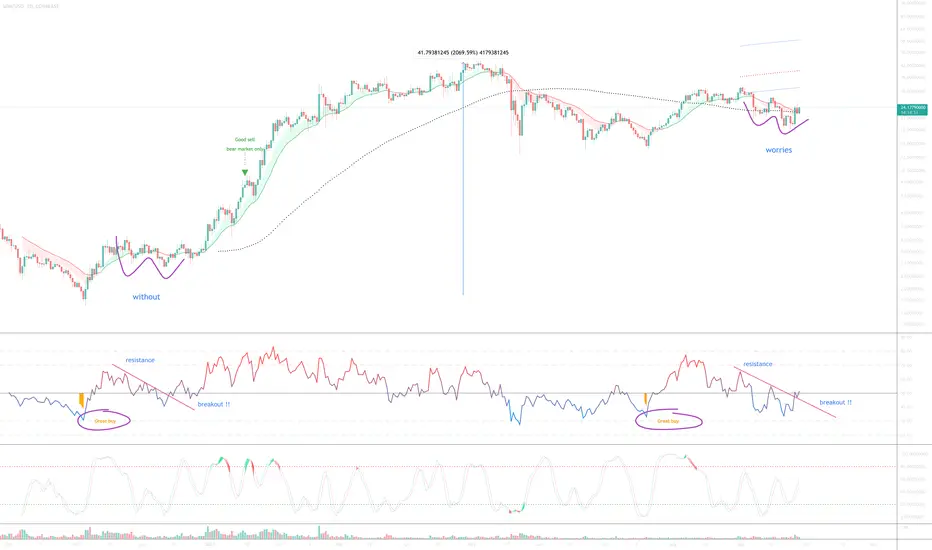
Uniswap - expect a large upside move - fractalThe last time a ‘great buy’ signal flashed on price action (during a bull market) (purple circles) price action moved up 2000%. Not saying that’s going to happened again. However we do have a fractal.
1) RSI resistance break out.
2) ‘W’ formation in price action printing a new higher low.
3) The new higher low prints on the golden ratio just as before.
4) Price action moves above the dotted line. Anyone know what it is? It is not a moving average!
5) Lastly, look at the weekly chart below. I’ve scanned all alt coins traded on Binance / Coinbase.. No other alt token is printing / closed with a Dragonfly DOJI candle on the weekly of this magnitude. This is huge buying pressure at play. (it is also printing on 10-day chart).
1st target $160
Good luck!
WW
Weekly chart
UNISWAP - Higher Prices Soon I Assume , 4% ScalpUNI is bouncing and moving up with a bit of buying pressure. This is just a quick scalp setup nothing too crazy, as volatility is high. With that said, it could run higher for sure. NFA, DYOR


UNIUSDUNIUSD D1 chart review. overall strong chart looks good. BULLISH compression pattern. focus on buying lower later. final swipe lower possible/likely. but then expect MASSIVE GAINS. chart looks good /strong. still valid today / great setup BULLS. BULL FLAG setup with massive upside. still expecting pullback off the highs. get ready to BUY LOW later. accumulation in range previously then we had 650% gains PUMP. we had 2 pumps already before this, 350% pump - pullback then 350% pump and now pullback mode. expecting short-term pullback. BULLS get ready to BUY after pullback. TP bulls is +350% gains later. expecting decent gains soon. 30-40% pullback short-term. recommended strategy: BUY/HOLD after pullback. TP BULLS +350% gains. SWING TRADE: BUY/HOLD IT. bull run not over yet.

UNI - Potential Bullish Reversal!Hello everyone, if you like the idea, do not forget to support with a like and follow.
UNI is sitting around a strong support zone in green so we will be looking for buy setups.
on DAILY: UNI is forming a channel in red but the upper trendline is not valid yet, so we are waiting for a new swing high to form around it to consider it our trigger swing. (projection in purple)
Trigger => Waiting for that swing to form and then buy after a momentum candle close above it (gray zone)
Meanwhile, until the buy is activated, UNI would be overall bearish can still trade lower till the lower green support before going up.
Good luck!
All Strategies Are Good; If Managed Properly!
~Rich

UNIUSD D1: 350%+ gains THE BEST Level to BUY/HOLD(SL/TP)(NEW)Why get subbed to me on Tradingview?
-TOP author on TradingView
-2000+ ideas published
-15+ years experience in markets
-Professional chart break downs
-Supply/Demand Zones
-TD9 counts / combo review
-Key S/R levels
-No junk on my charts
-Frequent updates
-Covering FX/crypto/US stocks
-before/after analysis
-24/7 uptime so constant updates
🎁Please hit the like button and
🎁Leave a comment to support our team!
UNIUSD D1: 350%+ gains THE BEST Level to BUY/HOLD(SL/TP)(NEW)
IMPORTANT NOTE: speculative setup. do your own
due dill. use STOP LOSS. don't overleverage.
🔸 Summary and potential trade setup
::: UNIUSD D1 chart review
::: updated/revised outlook
::: overall strong chart looks good
::: BULLISH compression pattern
::: focus on buying lower later
::: final swipe lower possible/likely
::: but then expect MASSIVE GAINS
::: chart looks good /strong
::: still valid today / great setup BULLS
::: BULL FLAG setup with massive upside
::: still expecting pullback off the highs
::: get ready to BUY LOW later
::: accumulation in range previously
::: then we had 650% gains PUMP
::: we had 2 pumps already before this
::: 350% pump - pullback
::: then 350% pump and now pullback mode
::: expecting short-term pullback
::: BULLS get ready to BUY after pullback
::: TP bulls is +350% gains later
::: expecting decent gains soon
::: 30-40% pullback short-term
::: recommended strategy: BUY/HOLD after pullback
::: TP BULLS +350% gains
::: SWING TRADE: BUY/HOLD IT
::: bull run not over yet
::: good luck traders!
::: BUY/HOLD and get paid. period.
🔸 Supply/Demand Zones
::: N/A
::: N/A
🔸 Other noteworthy technicals/fundies
::: TD9 /Combo update: N/A
::: Sentiment mid-term: BULLS
::: Sentiment short-term: BEARS/PULLBACK
RISK DISCLAIMER:
Trading Crypto, Futures , Forex, CFDs and Stocks involves a risk of loss.
Please consider carefully if such trading is appropriate for you.
Past performance is not indicative of future results.
Always limit your leverage and use tight stop loss.

Uniswap has to breakout triangle & 21further consolidation inside triangle.
a break above 20 would be bullish

Uniswap Price Analysis — December 20UNI continues to struggle with lasting bearish pressure as the cryptocurrency falls below the $15.00 mark, following a failed rebound from the $13.75 base. At press time, the twentieth-largest cryptocurrency is under a renewed bearish influence, as it barrels down towards $13.75 again. That said, a retest of this multi-month low in the near term could make or break the cryptocurrency as the new year draws near. As illustrated in the daily chart, a successful defense of the $13.75 base could ignite the long-awaited market rebound and push prices towards the $21.00s. However, failure to prevent bears from going below the critical support could fan the bearish flames and push prices to the $10.00 low.
Meanwhile, my resistance levels are $15.00, $16.00, and $16.75, and my support levels are $13.75, $13.00, and $12.00.
Total Market Capitalization: $2.14 trillion
Uniswap Market Capitalization: $8.95 billion
Uniswap Dominance: 0.41%
Market Rank: #20

Uniswap - Ready for fly?Hello friends.
This is my 3 scenarios about Uniswap
The chart will tell you everything 🙂
Bullish movement is more possible.
I will update this chart when we reach to our possible targets.

UNI/USD Time for reversal??Looks like a reversal of UNI/USD gonna be starting soon.. Based on Key support level/And the divergence

UNIUSD Trend and Wave AnalysisIt is in wave c and is moving towards the set price target
The wave you see in the future price on the chart is a schematic of a possible price trend and will not be formed just to clarify the possible price movement.
This is a personal analysis and should not be considered a criterion for buying or selling. Please pay attention the take profit and stop loss. Cryptos show emotional and unforeseen price behavior.
I use Elliott and Price Action in my analysis, and my analysis is based on that. The structure of the Elliott wave count is complex and different patterns are formed in the chart, so there is a possibility of a change in the price movement of the price.

Triangle chartworst case scenario, broke below 10.
best case scenario, the beginning or bull market.
long position hold for long term.

OBV needs decision of Uniswap - bullish breakout ahead?The Uniswap price is between a triangle.
RSI has enough room to keep growing.
But OBV is NOW at a decision-point 😎
Drop me a nice comment if you'd like me to analyze any other cryptocurrency.
*no financial advice
do your own research before investing

Uniswap (UNI) - November 30Hello?
Welcome, traders.
By "following", you can always get new information quickly.
Please also click "Like".
Have a nice day.
-------------------------------------
(UNIUSD 1W Chart) - Medium to Long-Term Perspective
Above the 8.7501025 point: the uptrend expected to continue
Since the wave is not complete, a drop from the uptrend line (1) could result in a sharp decline, so trade cautiously.
There is a possibility that we will continue to walk sideways to exceed the volume profile section of the 24.0724676-36.6077003 section, which is the high point section, so we need to think about countermeasures.
Therefore, it is important to keep the price above the uptrend line (1).
(1D chart)
The price should remain above the 20.8660947 point to continue the uptrend.
However, it is expected that there will be restrictions on the ascent due to the volume profile section formed over the section 24.0724676-36.6077003.
If the price declines from the 17.5714945 point, there is a possibility that it will fall near the 8.7501025 point, so trade cautiously.
------------------------------------------
(UNIBTC 1W Chart) - Mid- to long-term perspective
Above 0.0003540-0.0004158 section: Expected to create a new wave.
------------------------------------------
We recommend that you trade with your average unit price.
This is because, if the price is below your average unit price, whether the price trend is in an uptrend or in a downtrend, there is a high possibility that you will not be able to get a big profit due to the psychological burden.
The center of all trading starts with the average unit price at which you start trading.
If you ignore this, you may be trading in the wrong direction.
Therefore, it is important to find a way to lower the average unit price and adjust the proportion of the investment, ultimately allowing the funds corresponding to the profits to regenerate themselves.
------------------------------------------------------------ -----------------------------------------------------
** All indicators are lagging indicators.
Therefore, it is important to be aware that the indicator moves accordingly with the movement of price and volume.
However, for the sake of convenience, we are talking in reverse for the interpretation of the indicator.
** The MRHAB-O and MRHAB-B indicators used in the chart are indicators of our channel that have not yet been released.
(Because it is not public, you can use this chart without any restrictions by sharing this chart and copying and pasting the indicators.)
** The wRSI_SR indicator is an indicator created by adding settings and options to the existing Stochastic RSI indicator.
Therefore, the interpretation is the same as the traditional Stochastic RSI indicator. (K, D line -> R, S line)
** The OBV indicator was re-created by applying the formula to the DepthHouse Trading indicator, an indicator disclosed by oh92. (Thanks for this.)
** Support or resistance is based on the closing price of the 1D chart.
** All descriptions are for reference only and do not guarantee a profit or loss in investment.
(Short-term Stop Loss can be said to be a point where profit and loss can be preserved or additional entry can be made through split trading. It is a short-term investment perspective.)
---------------------------------

Fibo levels of UNIFibo levels:
X=$111
AB=0.61 XA
BC=0.38 AB
1.6 BC=$24.8
0.78 XA=$27
2 BC=$46.7
0.88 XA=$52.39
2.24 BC=$69.5
2.6 BC=$130
1.3 XA=$262
1.27 XA=$670
3.6 BC=$682
1.41 BC=$1669
4.23 BC=$1900
1.6 XA=$6594

uni - brangelabtczones are in. theres local resistance in between the two zones. buy volume is getting there. still neutral

4h UNIUSD: Likely will head to low 30'sAs above.
Broke out of down channel and touched bottom of larger support trend line.
Appears to be headed up towards top of larger top trend line in low 30's.
The Madrid ribbon also has crossed green on the 1D and that signals bullish uptrend at least in the short term.
Will follow.
Good luck traders!

Uni Swing ~Daily algorithmic buy indication for Uni using our proprietary system,
i think it's setting up for a wave 3
wave 3 target = $41
take some profit at the given fib levels just to be safe.
in my world, see profit = take profit.
i'm not chasing the entire move, just trying to catch some of it.
✌

UNI/USD up trend..BINANCEUS:UNIUSD I think it will go up now.. you can see the data showing up position..

#UNI Uniswap 1D - Big Move ComingHello friends, today I am reviewing the 1D chart for Uniswap (UNI) on a linear scale.
In the chart I noted:
1) The price has been in a long term triangle with a breakdown since May 2021.
2) Currently, the price hit the bottom of the long term trendline since January 2021 and bounced off of it.
3) The price has the potential to move up about 20% to around $25.41.
3) The RSI came out of the oversold region and has potential to bounce towards the top trendline.
4) The Ichimoku Cloud is above the price and at the top of the cloud is where the resistance is.
5) The Volume is currently very low. If volume comes in, we may be able to break out of this long term triangle.
What are your opinions on this?
If you enjoy my ideas, feel free to like it and drop in a comment. I love reading your comments below.
Disclosure: This is just my opinion and not any type of financial advice. I enjoy charting and discussing technical analysis. Don't trade based on my advice. Do your own research! #cryptopickk
