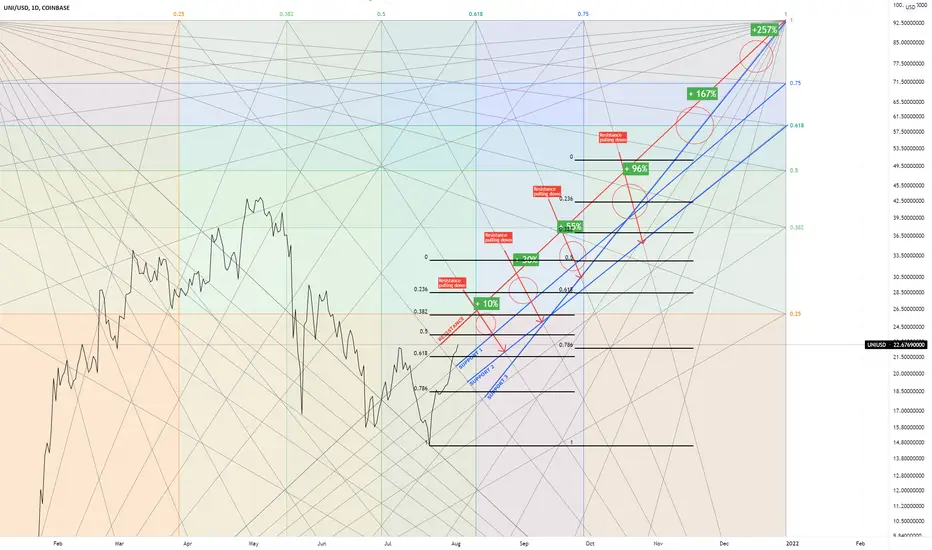
UNI primeUNI is prime for a move up, 4 h and daily timeframe starting to look oversold. Local HnS formed. Waiting for the breakout of the HnS and the descending wedge.
The most interesting part of UNI price action is the volume of the last few bars. The volume was extremely high which suggest sellers are locally exhausted, they tried to push the prices lower without succeeding creating an imbalance of supply and demand.
I am expecting higher prices with the targets highlighted in the chart.
Also, this high volume is on strong support, which reinforces its strength and the bullishness of the signs.
If you like the content FOLLOW ME, SHARE the chart nad LIKE.
You will help me to grow and other people to improve...I really much appreciate it.
If you have any questions feel free to COMMENT below.
UNIUSD trade ideas

Bullish or bearish for UNIGreen prediction: Should bulls ignore the bearish news today (SEC Lawsuit), green is the likely outcome provided by normal technicals.
Orange prediction: Technicals are very bullish on UNI, Orange is likely if the lawsuit impacts take time to tear down bearish technicals.
Red Prediction: This is the likely prediction as the news unfolds.

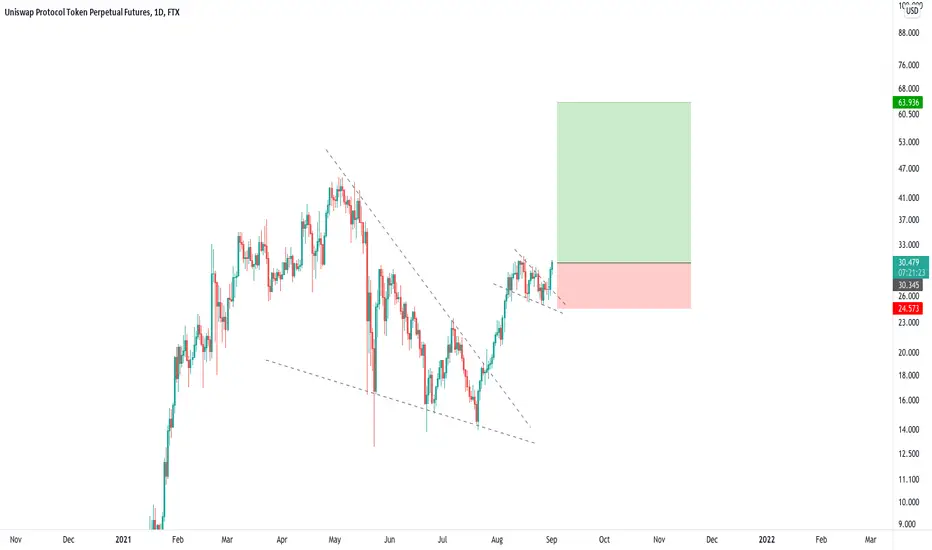
Uniswap (UNI) - Pennant BreakoutUniswap (UNI) - Pennant Breakout
Target: $39
........................

long uni here based on falling wedge break continuatintarget 1.168
stop under previous continuation pattern
UNISWAP/USDTThere is possibility of Temporary retracement to the proposed support line (26.25).
. provided that this is true, merchants can set requests dependent on Price Action and hope to arrive at momentary targets."
Specialized examination:
. UNIUSD is in an uptrend, and the continuation of the uptrend is normal.
. The cost is over the 21-Day WEMA, which goes about as a powerful help.
. The RSI is at 60.

UNIUSD H16: 150% gains BEST Level to BUY/HOLD (SL/TP)(NEW)Why get subbed to me on Tradingview?
-TOP author on TradingView
-2000+ ideas published
-15+ years experience in markets
-Professional chart break downs
-Supply/Demand Zones
-TD9 counts / combo review
-Key S/R levels
-No junk on my charts
-Frequent updates
-Covering FX/crypto/US stocks
-before/after analysis
-24/7 uptime so constant updates
🎁Please hit the like button and
🎁Leave a comment to support our team!
UNIUSD H16: 150% gains BEST Level to BUY/HOLD (SL/TP)(NEW)
IMPORTANT NOTE: speculative setup. do your own
due dill. use STOP LOSS. don't overleverage.
🔸 Summary and potential trade setup
::: UNIUSD 16hour//candle chart review
::: strong bullish chart overall
::: expecting upside breakout soon
::: accumulation in progress
::: currently pullback off heavy resistance
::: focus on buying low later from my level
::: to stay out of this market
::: recommend to focus on buying low
::: noteworthy compression / breakout soon
::: accumulation in progress / more time required
::: TP1 BULLS +100% gains TP2 BULLS +150% gains
::: it's a strong prior bull market so can
::: so expecting at least one final PUMP
::: BULLS get ready to BUY after pullback
::: TP bulls is 150% gains
::: TP BULLS +150% near 25/27.50 USD
::: patience required next few weeks
::: BEST reload BULLS is near range lows
::: as we are getting ready for a move now
::: final TP BULLS is +100%/+150% gains max
::: BULLS seek to BUY LOW near my level
::: final TP BULLS is +150% gains buy/hold
::: good luck traders!
🔸 Supply/Demand Zones
::: N/A
::: N/A
🔸 Other noteworthy technicals/fundies
::: TD9 /Combo update: N/A
::: Sentiment mid-term: BULLS/BUY PULLBACK
::: Sentiment short-term: BEARS/CORRECTION
RISK DISCLAIMER:
Trading Crypto, Futures , Forex, CFDs and Stocks involves a risk of loss.
Please consider carefully if such trading is appropriate for you.
Past performance is not indicative of future results.
Always limit your leverage and use tight stop loss.

UNI/USD double bottom opportunity 22.00000000Best price would be 22.00000000 USD
Area of demand zone exactly in line with previous significant resistance now will become support
Just patiently wait for it

Uniswap (UNI) - August 26Hello?
Welcome, traders.
By "following", you can always get new information quickly.
Please also click "Like".
Have a nice day.
-------------------------------------
(UNIUSD 1W Chart)
If the price is maintained above the 8.75010245-12.92996012 range, the uptrend is expected to continue.
(1D chart)
We need to see if we can break out of the downtrend line by moving towards the 30.64308018-33.25051255 section.
If it falls from the 26.42093574 point, it can touch the 17.75218020-20.86609475 range, so you need to trade carefully.
It is a weak support and resistance point, but should move above the 36.60770033 point to accelerate the uptrend.
-------------------------------------
(UNIBTC 1W chart)
If the price holds above the 0.00035399-0.0041575 range, we expect the uptrend to continue.
(1D chart)
We need to see if we can reorient ourselves by ascending to the 0.00058765-0.00064499 section.
If this continues, we should see support at the 0.00047297 point.
Looking at the big picture, the section 0.00047297-0.00058765 is a sideways section.
If the price is maintained in this consolidation zone, it is expected to turn into an uptrend.
However, in order to continue the uptrend, it must rise above the 0.00064499 point.
------------------------------------------
We recommend that you trade with your average unit price.
This is because, if the price is below your average unit price, whether the price trend is in an uptrend or in a downtrend, there is a high possibility that you will not be able to get a big profit due to the psychological burden.
The center of all trading starts with the average unit price at which you start trading.
If you ignore this, you may be trading in the wrong direction.
Therefore, it is important to find a way to lower the average unit price and adjust the proportion of the investment, ultimately allowing the funds corresponding to the profits to regenerate themselves.
------------------------------------------------------------ -----------------------------------------------------
** All indicators are lagging indicators.
Therefore, it is important to be aware that the indicator moves accordingly with the movement of price and volume.
However, for the sake of convenience, we are talking in reverse for the interpretation of the indicator.
** The wRSI_SR indicator is an indicator created by adding settings and options to the existing Stochastic RSI indicator.
Therefore, the interpretation is the same as the traditional Stochastic RSI indicator. (K, D line -> R, S line)
** The OBV indicator was re-created by applying a formula to the DepthHouse Trading indicator, an indicator disclosed by oh92. (Thanks for this.)
** See support, resistance, and abbreviation points.
** Support or resistance is based on the closing price of the 1D chart.
** All descriptions are for reference only and do not guarantee a profit or loss in investment.
Explanation of abbreviations displayed in the chart
R: A point or section of resistance that requires a response to preserve profits.
S-L: Stop Loss point or section
S: A point or section where you can buy to make a profit as a support point or section.
(Short-term Stop Loss can be said to be a point where profit and loss can be preserved or additional entry can be made through split trading. It is a short-term investment perspective.)
GAP refers to the difference in prices that occurred when the stock market, CME, and BAKKT exchanges were closed because they are not traded 24 hours a day.
G1 : Closing price when closed
G2: Opening price
(Example) Gap (G1-G2)

UNISWAP is a BullishUNISWAP is moving by breaking above the key resistance level. Now the price is getting correction from the dynamic 20 EMA. Therefore, as long as the price is trading above the dynamic 20 EMA, it has a higher possibility of moving up in the coming days.

UNI.USDT (Y21.P5.E1).Macro TargetHi Traders,
Another coin that is likely to do well.
Using Fibonacci on previous price action, I'm looking at new price discovery to abide fib extension levels as per tadeonal TA.
All the best,
S.SAri

UniSwap UNIUSD - Road to 350 USD + 1000% gains!- UniSwap looks very strong on the daily timeframe.
- On the chart we can spot an ABCDE triangle, that is currently breaking out!
- Due to my Elliott wave count, i am expecting next Impulse wave to the upside, which will be huge!
- Next profit target is 1:1 FIB trend-based fib extension.
- For expected duration of the trade, probability, stop loss, profit target, entry price and risk to reward ratio ( RRR ) - please check my signature below ↓
- If you want to see more of these ideas, hit "Like" & "Follow"!

UNIUSD SELL SETUPUNIUSD is bearish in 4h and 15min timeframe (both are part of wyckoff). Possible 4h LPSY could trigger a sell setup in 15min timeframe.

UNI to 60this chart it looks ready for a move i would buy it on the break and set a 45 cent stop loss

Uniswap UNIUSD -1000% is near, Elliott wave + Triangle!- UniSwap looks very strong on the daily / weekly timeframe.
- On the chart we can spot an ABCDE triangle, that is currently breaking out!
- Due to my Elliott wave count, i am expecting next Impulse wave to the upside, which will be huge!
- Next profit target is 1:1 FIB trend-based fib extension.
- For expected duration of the trade, probability, stop loss, profit target, entry price and risk to reward ratio ( RRR ) - please check my signature below ↓
- If you want to see more of these ideas, hit "Like" & "Follow"!

I want to buy UNIUSDUNI is sitting bullishly above the 200MA as it is transitioning through 2.618
I want to buy some, lacking free capital
This is a great entry for a long position
Price can be observed breaking out of the blue circle (1.618)

Potential UNI shortLooking at shorting UNI-PERP down to the 38 or 50 fib retracement on the daily which would still indicate a new bullish run.
This is a riskier trade as it's technically counter trend trading, but i like the setup for the below reasons:
It has hit a level of resistance/supply zone on the daily and is rejecting. looking like about to form an evening star on the daily (please note candle hasnt closed yet so not confirmed)
On the 4hr it has hit this resistance level, looks like it's rejecting and has printed out divergence.
On the 1hr you can see the impulses up have been getting shorter (yellow lines), is now divergent, rejecting and has printed a bearish engulfing candle which is my last checklist item to enter.
Will monitor closely when it reaches the mini trend line coming up, but i believe a retracement to at least the 38 fibs is healthy and will give me a good R:R of approx 4.5x
Daily
1hr impulses
4hr divergence
Descending wedge breakoutLong position for UNI after the breakout, first target 24$ then 29-30$. What do you think?

$UNI longTrend reversal, entered on pullback to cluster of pivot , fib + flip level
RR target and stop areas marked by shaded green/red area

Uniswap UNIUSDT - Breaking out! Triangle + Elliott Wave- UniSwap is looking very strong on the daily / weekly timeframe.
- On the chart we can spot a ABCDE triangle, that is currently breaking out!
- Due to my Elliott wave count, i am expecting one more Impulse wave to the upside.
- For expected duration of the trade, probability, stop loss, profit target, entry price and risk to reward ratio (RRR) - please check my signature below ↓
- If you want to see more of these ideas, hit "Like" & "Follow"!

UNISWAP ANALAYSIS As the illustration . the chart has created double bottom and the target is about 28$. How ever we should chase volume and Momentum on mid-time frame MA55 .
As the result the chart is completely bullish.

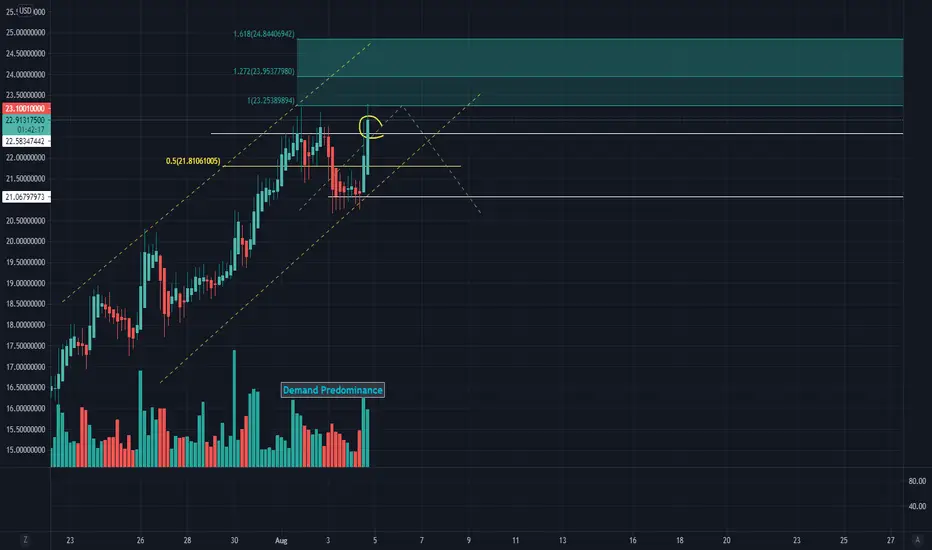
UNI Ascending Channel w/ Demand PredominanceI didn't want UNI to run any further without sharing our posiiton. Jumped in with a small preliminary in the hopes the trajectory stays on course. Judging by vertical volume, smart money is fueling this crypto in its present advancements.
*Like big wins and big money? Got strong hands and patience? Good! Same here.
I'm a full-time cryptocurrency swing trader (since 2017) and regularly seek out the most lucrative swings available on all the major crypto exchanges.
My win rates are between 80-85%. Follow me on TradingView and see for yourself.
All my charts are clean, straightforward, and easy to follow. No junk, no needless indicators -- just volume & spread analysis with simple 'take-the-money-and-run' Fibonacci target zones.
Good luck and safe trading!
** Not financial advice. Please trade at your own risk.
UNIUSD $100Using this top cap indicator for UNI we can plot potential tops
Congruent with my other analyses suggesting an early 2022 end to the bull market, I think UNI will top out late 2021 to early 2022
At this point price will be around $100, which is provided using this indicator
Price now has triple bottomed on the lower blue band
I find this a great entry point for UNI
I am tempted to enter this once my capital allows it

UNI: Time is clockingRetraction Using Gann Box and Fibonacci.
The analysis above indicates one of the possibilities of an uptrend.