Uniswap Analysis: A Strong Case for Buyers as Token Aims for $10
Uniswap ( BME:UNI ), the native cryptocurrency of the decentralized trading protocol Uniswap, is currently showing strong signs of a bullish breakout, with the potential for a 50% rally to $10-$11.
Price Momentum and Technical Analysis:
Over the past week, BME:UNI has witnessed a remarkable 25% gain, currently trading at $7.604 with a market cap of $4.6 billion. BME:UNI successfully turned a crucial supply barrier at $7.23 into a support level, with over 20 million BME:UNI held across 3,500 addresses. This shift in support suggests a bullish move, potentially reaching the $10 target.
From a technical perspective, Uniswap is navigating a trading range with a support level of $4.364 and a resistance level of $8.445. The 10-day Simple Moving Average (SMA) stands at $6.7, signaling a bullish trajectory. A successful breach of the $8.445 resistance could propel
( BME:UNI ) towards the next target at $11.283.
Key Developments and Growth
Beyond price movements, Uniswap has demonstrated substantial growth and development. The decentralized exchange has expanded its user support by integrating new features and extending its reach into the Bitcoin ecosystem. Uniswap's presence on Rootstock, a sidechain connected to the world's largest blockchain network, provides users with advanced functionalities for seamless trading.
Additionally, Uniswap Labs has introduced a new Android mobile wallet app, enhancing accessibility to the decentralized finance (DeFi) realm. This move follows the successful closed beta of the Android app in October and the iOS version introduced in April. Uniswap's commitment to user expansion and innovation is evident in these strategic initiatives.
Investment Opportunity and Conclusion
Considering the positive technical indicators, successful support level transformation, and the continuous expansion of Uniswap's ecosystem, the current trajectory of UNI reflects not only numerical dynamics but also growing interest and confidence in decentralized finance. For potential buyers, this presents a compelling investment opportunity.
As the market sentiment remains positive and technological advancements continue through recent partnerships, there is a potential for UNI to rally further. However, buyers should stay vigilant and monitor market conditions. A breach of resistance at $8.445 could trigger a move towards $10, and ultimately $11.283, while a break below the support at $4.364 may lead to a correction.
Uniswap's ( BME:UNI ) current position in the market, coupled with its strategic growth initiatives, makes it an intriguing choice for buyers seeking exposure to the decentralized finance sector.
UNIUSD trade ideas

UNIUSD - Great BreakoutUNI has broken out of a down move
This is evident when plotting an upper trend line
I have shown the two rejections with red thumbs and the breakout with the green one.
The prior ATH is way above here, there may be some bumps along the way but im confident it will head back in that direction, as most bull charts do.

Time for a pullback?UNIUSD with a nice bounce on top of the channel on the daily. Normally that would signal a long position for me but with such a run up over the last few weeks i think i will pass on this trade. I might be wrong but i would imagine a pullback below the channel in the next week. Maybe look for a short then. This is definitely not financial advise so its not.

Uniswap (UNI) Has Shown Minimal Growth
During December 2023, the UNI token has shown minimal growth. Despite reaching a yearly high of $7.07, UNI's market behavior largely reflects Bitcoin's trends.
The asset is currently fluctuating within a sideways range, with support at $5.9 and resistance at $6.4. If buyers maintain momentum, Uniswap's price could potentially retest the resistance zone of $6.70-$7.07 and aim for a new high. However, future movements will hinge on Bitcoin's trajectory.
A deeper correction could see UNI drop to buying zones at $5.27-$5.62, $4.63-$5.00, and down to $4.45, creating opportunities for accumulating long positions in anticipation of a possible upswing.

UNISWAP → Falling out of Bull Channel to $4.80? Let's Answer.Uniswap has fallen out of its Bull Channel and is surfing on the Daily 30EMA! After Bitcoins harsh selloff at resistance, is Uniswap and the entire crypto market about to reverse to previous lows?
How do we trade this? 🤔
Uniswap price action is currently going sideways in a trading range, a typical signal when a Bull Channel has come to an end. What we need now is a sell signal to confirm the price is going down and we need to look for it at the Left Shoulder high price of $6.86. If we get a strong sell signal bar and confirmation closing on or near their lows at that price, then we will have a Head and Shoulders reversal pattern playing out, giving us the necessary justification to short. Keep an eye on Bitcoins behavior as well to see if the general market sentiment is shifting.
My latest analysis on Bitcoins future here:
💡 Trade Idea 💡
Short Entry: $6.27
🟥 Stop Loss: $6.89
✅ Take Profit: $5.03
⚖️ Risk/Reward Ratio: 1:2
🔑 Key Takeaways 🔑
1. Fell out of Bull Channel, Trend Changing.
2. May bounce off of 30EMA and attempt Left Shoulder Price.
3. Look for potential Head and Shoulders Reversal Pattern.
4. RSI at 50.00 and below Moving Average, Bias to Short.
5. Reasonable to Short if Sell Confirmation on Right Shoulder.
⚠️ Risk Warning! ⚠️
Past performance is not necessarily indicative of future results. You are solely responsible for your trades. Trade at your own risk!
Like 👍 and comment if you found this analysis useful!

$UNIUSDT: Long term bull cycle signal#Uniswap finally triggered a long term trend here, very low risk chance to start buying into it.
Upside of roughly 1500% is quite appealing, considering risk to the stop here.
Best of luck!
Cheers,
Ivan Labrie.

UNISWAP → Bull Channel Continues! Price Target of $7.25?Uniswap is showing bull channel support and is indicating the price wants to continue upward toward the $7.25 range. Should we long here? Or is the previous channel resistance around $6.50 going to send us back to the depths?
How do we trade this? 🤔
It's reasonable to long now. We have a bull signal candle at channel support followed by an additional bull candle that's not as strong as we would like to see, but a bull candle nonetheless. It's reasonable to see if the current 4HR candle closes on or near its high before entering a long. Entering here and setting a protective stop below the channel support is ideal, take profit at 1:2 Risk Reward around $7.14 just before the Resistance Zone.
💡 Trade Idea 💡
Long Entry: $6.28
🟥 Stop Loss: $5.85
✅ Take Profit #1: $7.24
⚖️ Risk/Reward Ratio: 1:2
🔑 Key Takeaways 🔑
1. Bull Channel, Bias to Long!
2. Bull Channel Showing Support.
3. Gap to Resistance Zone (Previous High).
4. RSI at 60.00 and above Moving Average, Bias to Long.
5. Reasonable to Long Here for best Risk/Reward.
⚠️ Risk Warning! ⚠️
Past performance is not necessarily indicative of future results. You are solely responsible for your trades. Trade at your own risk!
Like 👍 and comment if you found this analysis useful!

🚀 Uniswap Analysis: Unleashing the Potential!Uniswap presents an intriguing yet complex chart. I believe we are in a primary Wave (1), Wave (2) structure (Dark Blue). This has formed a Wave 1, Wave 2, and is now in the process of forming Wave 3, which is simultaneously a Wave C or a sub-wave (v). Following this, we expect Wave 4 and then Wave (v) or the overarching Wave (3).
With this structure, we anticipate a substantial increase, reaching at least the Level (1) target, which should be achieved, especially if considering only a Wave C. Given that Wave ((B)) forms a Flat, a standard Flat implies a 100% correction. Therefore, aiming for around a 70% minimum target post-entry zone makes sense. 📈✨

UNI Weekly (Uniswap)1. Clear weekly cup+handle
2. 12EMA on verge of crossing 26EMA
3. Entry now, and as low as backtest of SMA50 at handle
4. Warning: Many prior cup+handles failed, stops are generally a good idea

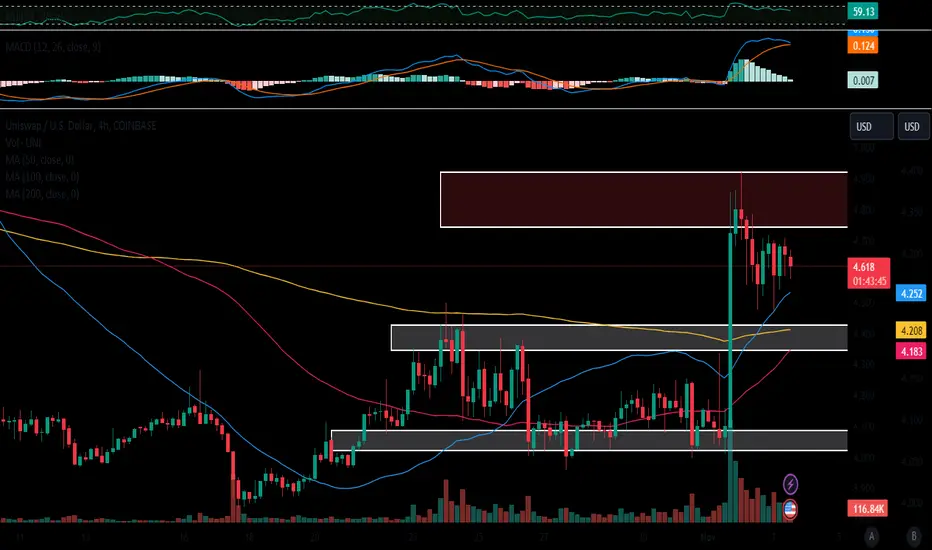
Uniswap → Down We Go! A Quick Scalp Opportunity Right Here.Uniswap has produced two strong sell signals and is setting its sights on the bottom of the bull channel and previous high of $5.62. We are still in a bull channel, so our bias should remain long. Should we Long or Short?
How do we trade this?
There is a quick scalp opportunity here. A scalp sacrifices Risk/Reward for Probability . In this case, we have several factors pointing to a pullback to channel support or the previous high at $5.62. Two pin bar bear signals, an RSI below the Moving Average, and Bitcoin failing to break Weekly Resistance.
Your position size should be proportional to your maximum loss amount for your account. Because the trade setup is a 1:1 Risk/Reward Ratio, size your position smaller than it would be if the Risk Reward were 1:2. You want to be able to run this trade 100 times and come out with a profit. If the probability of this trade is over 50% and you risk as much as your potential reward, the result is a positive dollar amount, making this a reasonable trade.
Trade Idea
Short Entry: $6.15
Stop Loss: $6.61
Take Profit: $5.69
Risk/Reward Ratio: 1:1
Key Takeaways
1. Strong bounce back into the Bull Channel.
2. Strong Sell Signal at Bull Channel Resistance.
3. Second Sell Signal at last Bar.
4. RSI near 50.00 and below Moving Average.
5. Short to $5.70.
You are solely responsible for your trades, trade at your own risk!
If you found this analysis helpful, click the Boost button and let us know what you think in the comment section below!

Uniswap - Navigating the Accumulation Phase! 🚀Hello Crypto Enthusiasts! 👋
In my view, Uniswap is currently in a prolonged accumulation phase on the larger scale.
The level at $3.37 serves as our support line and a crucial level for the overarching Wave II.
Upon closer inspection, let's focus on two decisive images.
On the second image, we confirm that Wave (2) is validated by an A-B-C ZigZag correction. Subsequently, Wave 1 and 2 have already been formed.
I anticipate that we haven't surpassed Wave 1 yet. Instead, we are likely forming a Wave iv and possibly gearing up for a leading Wave v, which will then shape Wave 3. 📊✨
Goodbye 🫡

Can UNISWAP Find A Bullish Breakout TO Cross $8?Rounding Bottom Struggle: UNI faces challenges breaking out of a rounding bottom pattern in the daily chart, encountering resistance despite bullish momentum.
Golden Crossover Tease: The 50-day and 200-day EMAs hint at a potential golden crossover, indicating a reversal, despite RSI showing bearish divergence.
Breakout Projection: A successful bullish breakout could propel UNI price towards the $8 mark, following a significant pullback and consolidation.
Rejection and Pullback: Previous rejection at $6.680 led to a substantial pullback to $4, resulting in a consolidation phase between $4 and $4.90.
Bullish Breakout: UNI experiences a bullish breakout above the 50D and 200D EMAs, with increased intraday volume, marking a 56% jump to reclaim $6.
Current Price & Trend: UNI trades at $6.20, displaying a slight intraday fall, reflecting a rounding bottom pattern and ongoing struggle to sustain the uptrend.
Technical Indicators - RSI & EMA: RSI shows bearish divergence, while the EMAs tease a golden crossover certifying a potential trend reversal.
Potential Breakout Impact: A successful bullish breakout could lead to a retest of $8, indicating a potential 27% increase in UNI price.
Support and Retest: Conversely, dropping below $6 might lead to a retest of $5.73, suggesting a possible correction if the breakout fails.

Uniswap Surges As Defi Market Hits 14-Month HighUniswap X's cumulative trading volume surpasses $1 Billion as new fillers come in accumulating more than 50% of the transaction volume.
Uniswap X, the permissionless and open-source protocol for trading across Automated Market Makers (AMMs) and other liquidity sources, has reached a milestone, with its cumulative trading volume surpassing $1 billion since its launch in July this year.
Market makers Wintermute and Tokka Labs have consistently dominated, accounting for 60%-80% of the daily trading volume.
New Fillers Taking Over On Uniswap X
Despite the current Defi market domination, there is room for new and different players to emerge on top. In a noteworthy event, a recently onboarded Filler on Uniswap X claimed the top spot within the past month.
Currently, there are 15 active Fillers, with 4 more onboarding. The competition among Fillers is intensifying, raising questions about the optimal number of Fillers to achieve the best price and the shortest transaction time.
In the last month, a new Filler disrupted the status quo by capturing over 50% of the volume since its onboarding, dramatically reducing the 2nd filler’s share from 90% at the launch to approximately 20%. The 3rd Filler also commands around 20% of the trading volume, and notably, all three top performers are market makers.
Uniswap Performance Recently
Since the latest crypto bullish wave, Uniswap (UNI) has been the best-performing top coin. Over the last seven days, the Uniswap price has increased by around 24%, from roughly $5.09 to $6.35.
The transaction lifted UNI’s market value to $4.8 billion, its highest level since August. UNI is currently valued more than Bitcoin Cash (BCH), but it is still 86% less than its all-time high, which reached its peak in 2021.
Additionally, it has been seen that token holders are cutting out a profit after the price jump. As per Lookonchain data, user stevu.eth withdrew a substantial amount of UNI tokens from Binance, holding a sizable amount valued at $3.18 million.
Talking about the whole Defi market, the ecosystem is blooming. As of November 2023, the total Defi market cap resides at $58 billion according to TradingView data. The Defi market hit the valuation 14 months after the previous Defi bubble in 2022.

Uniswap Bull Spike! Are we going back down to $5.70?Uniswap took off like a rocket after making contact with the 200EMA, going from $4.85 to $6.30, a nice 30% rip! We're now approaching the bull channel resistance, will we keep going up? Or will we see a rejection and fall back down to the previous support?
How do we trade this?
This isn't a reasonable to long or short this timeframe. The gap between the 200EMA and the bull channel resistance has been closed and if we're going to short, we need a sell signal bar and confirmation bar before we enter. RSI is near 80.00, a weak indicator by itself, but supports the other points of this analysis.
If the price breaks above the bull channel resistance and shows support, then it may be reasonable to long.
Key Points
1. Strong bounce back into the Bull Channel.
2. Price near Bull Channel Resistance.
3. Wait for a sell signal at Bull Channel Resistance.
4. RSI near 80.00, More Down than Up.
5. If shorting, reasonable take profit at $5.70
You are solely responsible for your trades, trade at your own risk!
Let us know what you think in the comment section below!

Uniswap (UNI) What Could Happen if the Price Consolidate
UNI has been on an upward trajectory. Since November 16, the asset has appreciated by 60%, with a notable increase from $4.85 to $6.30 (+25%) in the past two days.
With Bitcoin's chart showcasing an upward trend, the continued growth of the UNI token remains a likely scenario. In the upcoming days, buyers can try and surpass the annual high and challenge the $6.7 resistance level. However, this requires the asset's price to first consolidate above the $6 mark.
Should a correction occur, UNI might fall to support zones around $5.4-$5.7, $4.6-$5, and $4.31. Placing limit orders for buying the asset might be risky, as Uniswap token, along with other altcoins, could suffer from liquidity shortages in the event of a significant drop in BTC. This situation could lead to the asset's price plunging well below these support levels.
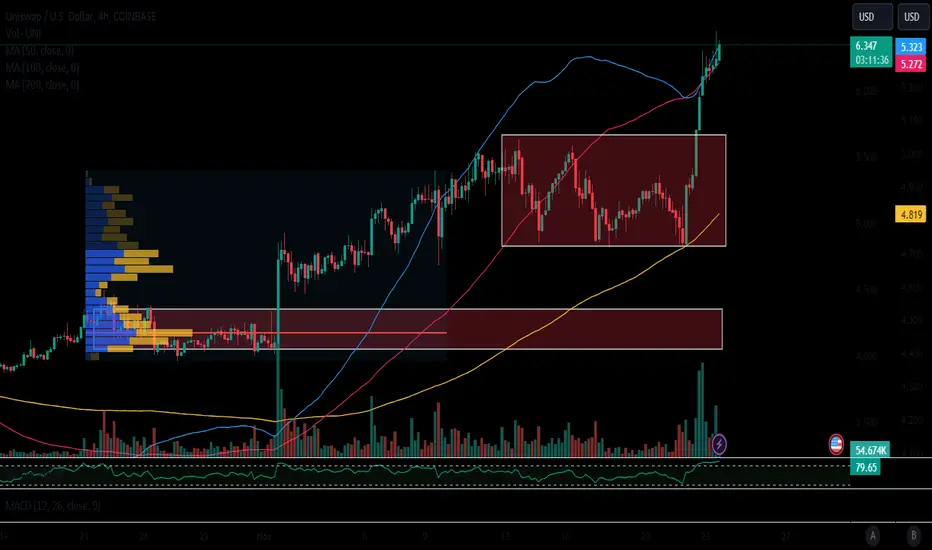
UNIUSD Channel Down broke upwards but faces the 1D MA100.Uniswap (UNIUSD) broke above its 16-month Channel down, being the highest above the 1W MA50 (blue trend-line) since November 2021. This legitimate bullish reversal rally now faces the most important (and final) Resistance of the Bear Cycle, the 1W MA10 (green trend-line).
With the 1W RSI on a huge Bullish Divergence (as it trades within a Channel Up against the Channel Down of the price), if we close a 1W candle above the 1W MA100, we will buy and target 7.9000 (0.786 Fibonacci level) and 9.8000 (1.0 Fib) in succession.
Until this 1W MA100 break-out takes place, we are bearish, targeting 4.4000.
-------------------------------------------------------------------------------
** Please LIKE 👍, FOLLOW ✅, SHARE 🙌 and COMMENT ✍ if you enjoy this idea! Also share your ideas and charts in the comments section below! This is best way to keep it relevant, support us, keep the content here free and allow the idea to reach as many people as possible. **
-------------------------------------------------------------------------------
💸💸💸💸💸💸
👇 👇 👇 👇 👇 👇

Uniswap at Resistance! Is a Drop to $5 Inevitable?Uniswap is up against the previous channel resistance around $5.50 after falling back down to $4.85. The last attempt to break $5.50 ended in a triple top, this may be a last attempt and with a failure, could lead to another pullback to the bottom of the trend. Bitcoin is currently at risk of a pullback as shown in my 4HR and Weekly analysis. Being a leading indicator, it is another data point in our trade decisions.
How do we trade this?
A short is risky without a sell signal, and a long is risky because we're at resistance. We're also in a bull trend so the probability of profit is less when shorting. Better to wait for more price action before entering a trade.
Key Points
1. Bull Channel, our Mode of operation should be "Always in Long"
2. The price is currently at a Previous Resistance Level
3. Bitcoin as a leading indicator, is at resistance
4. A Pullback to $5 is likely
5. Wait for more price action
You are solely responsible for your trades, trade at your own risk!
Let us know what you think in the comment section below!

UNISWAP PRICE PREDICTION 2023-2032: WILL UNI KEEP STEADY?UNISWAP PRICE PREDICTION 2023-2032: WILL UNI KEEP STEADY?
Uniswap Price Prediction 2023-2032
Uniswap Price Prediction 2023 – up to $8.44
Uniswap Price Prediction 2026 – up to $27.34
Uniswap Price Prediction 2029 – up to $86.78
Uniswap Price Prediction 2032 – up to $264.71
For anyone considering the switch from centralized finance (CeFi) to decentralized finance (DeFi), here’s a thought: Why do we constantly update the Uniswap Price Prediction? The fight is on for the survival of the fittest crypto project, and we need to keep you informed despite social media maneuvers by certain quarters!
How much is UNI worth today?
The current Uniswap price stands at $5.03, having seen a trading volume of $147,857,135 in the past 24 hours. With a market capitalization of $2,962,899,131 and a market rank of 27, it demonstrates an increase of 7.69% over the last 24 hours.

UNI LONGUNI has gained and retested an important level. This is in my opinion a good level to open a long

UNI & Sushi Neglected BlueChips : Repricing in 2024? UNI - Blue Chip massively cheap could see reprice in 2024.
Sushi- Future Blue chip bet... currently not used but is carving a crosschain Niche currently not even in top 100 tokens.
Uni deeper dive-
No one seems to want to buy UNI because of the "token not needed" narrative. The impact on crypto is massively under represented in the market cap of UNI. Top 3 innovation and it is ranked 25th.
The token narrative is bad at the moment, but these things tend not to matter as much as one might assume and what is currently happening in the UNI community regarding the token can change in the future.
The reprice of UNI would catch all of the market off guard.
Purely from a market analysis this seems to be a textbook depression for a token that could both reposition higher in crypto market share and grow with the market.
Sushi Deep Dive -
More research needed on this one but. at first glance, this ecosystem is building and delivering product to support a bridgeless crosschain niche while partnering (fully implementing) the chainlink CCIP cross chain protocol. If CCIP and Chainlink see growth this cycle then value could accrue to this token
contrary to UNI, sushi has built in rewards to token holders and from current volumes it can be expected that volumes will only increase.
Most importantly... this token is dirt cheap compared to the other 150 tokens ahead of it currently in market cap. currently it is around 250 million total and this could easily be 2B or 10B+ if speculative narratives flow this way.

Uniswap (UNI) Fluctuating Between The Support Level Despite Uniswap (UNI) exhibiting a rather muted response to Bitcoin's October gains, it has seen a significant uptick in the last few days, surging 20% and setting a new local high at $4.92.
UNI is currently fluctuating between the support level of $4.48-$4.57 and a resistance corridor of $4.78-$4.92. If this positive trend continues, echoing Bitcoin's chart movements, Uniswap's token is likely to maintain its ascent.
The next targets for buyers are the psychological level of $5 and the $5.2 mark. In case of a correction, UNI could test the support levels at $4.31 and between $4.10-$4.22 without disrupting the prevailing uptrend.
[C-013] UniswapTrading idea number C-013 | Uniswap may rise to to 5.12 USD area.
The RSI is trading below 30. This could mean that price is in an oversold phase and therefore a rebound could take shape. As a bullish mean divergence is present. The MACD is above its signal line and is negative. In addition, price is above the 20-period average.
📈 Long Entry at 4,425
💰 Take Profit at 5,120
💸 Stop Loss at 4,030

UNIUSD long positionHello everyone!
UNIUSD has been in a downtrend. When the price reach the support we expect it to go up to the downsloping resistance.
Our target is at diagonal resistance.
Let us know in the comments what you think about it.
