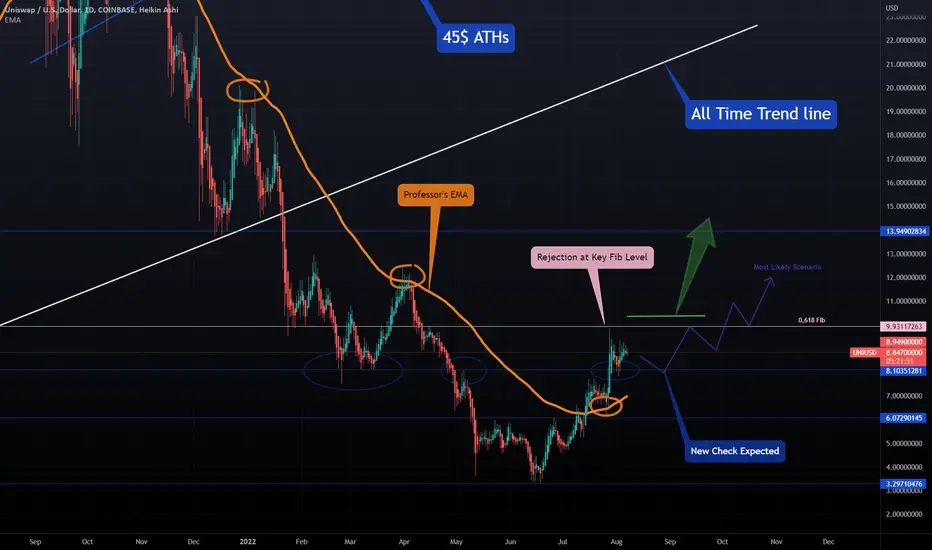
UNI - Taking ProfitStaggering out of UNI here but once this crosses the trendline it may turn south fast.
138% trade here from the lows and I even took profit and bought back in lower along the way.
There's still a chance this can have a sudden blow off top but the structure of this move is very corrective and it will be heading down soon enough I think along with everything else.
Not advice.
UNIUSD trade ideas

UNI/USDand here is some analyiz about UNISWAP. The ascending condition of UNI is to follow pathline that i have drawn.

UNI UPDATEI think UNI has been an easy chart to guess and follow so far.
As I suggested in my previous update - after losing the trendline and the support at $8ish area. Price retested the area and gave a perfect entry for a short. (hope someone out there took the chance to make some money on this)
Now approaching another strong support area around $6.2 - $6.5. I'de be keen to see the reaction there. I think it would be a nice opportunity to long. Possible target around $8 again. Bu I would keep an eye open until price moves over $7.3
Lose the &6.2ish and price is going to the next level of support.
Obviously keep and eye on the big guy BTC to see how things are going.
As the decline started to possible new lows, we want to see LH and LL forming.
if you decide to long.. USE STOP ORDER! always play safe! ;)
DO NOT FOLLOW MY MOVE BEFORE YOU DO YOUR OWN RESEARCH, THIS IS AN IDEA - NOT A FINANCIAL ADVICE!!

UNI UPDATETrying to figure it out?? yeah me too..
So it's all relevant to what the big guy BTC will do.
Price is nicely moving within the range for the last few days.
Some really good opportunities for scalping there. Did you take advantage of this so far?? ;)
As we are approaching the range low again it is important to see if the price will bounce. Break the low and lose the trendline and we are probably heading to the next line of support i.. (if you want to short wait for confirmation)
if price starts moving up keep an eye on the EQ and then range high.. No idea if it will go for another heigh or double top. Will have to wait and see. TBH UNI is looking a bit tired in comparison to other alts but who knows.. (if you want to go long keep an eye on BTC as well before you jump in).
Price action has been really bad today... be cautious
Do not follow my moves before you do your own research, This is an ideas not a financial advice.. Play Safe!!

hi guy for UNISWAPhi every body hope all of you uesd this powerful signal for long position. the next target is 10.50
lets goooo.. bo

UNISWAP - Let's Take a Good Look 🔍REPORT:
Uniswap facilitates the trading of tokens on the Ethereum network along
with its scaling solutions such as Optimism, Arbitrum, and Polygon. The
protocol is recognized as a pioneer among decentralized exchanges
(DEXs), first for its popularization of the X*Y=K constant product pricing
curve of pooled liquidity in V2 — and subsequently for its concentrated
liquidity and staggered trading fee features in V3. The constant product
pricing curve has since been implemented across many other DEXs in the
industry. The concentrated liquidity model and fee tiers continue to remain
relatively unique across DEX applications.
Q2 was heavily impacted by fears of market contagion. First, the LUNA
ecosystem crashed when the UST stablecoin depegged. A few weeks later,
concerns around price mismatching between ETH and its staked
equivalent, stETH, began to abound. Funds with large exposure to both bets,
particularly Three Arrows Capital (3AC), faced heavy losses. When the
crypto community realized the risk of insolvency among funds and
affiliated centralized lenders, investment sentiment turned negative, driving
down the market capitalization of cryptocurrencies from over $2 trillion at
the start of the quarter to $870 billion by the end of Q2.
Although the larger cryptocurrency market capitalization decreased more
than 50%, Uniswap trading volumes were only down 8.7% compared to the
previous quarter. This relative success is partly due to volatility being
beneficial for DEXs: they represent foundational infrastructure to the crypto
economy, and users require their services when prices are volatile. Another
important factor is the activity of arbitrage bots in the system. When users
flush out of the market, bots can represent up to 75% of all trading volume,
which is a healthy sign. DEXs have matured in the last two years to the point
where activity is driven by price efficiency instead of pure retail speculation.
Supplied liquidity on the DEX held up better than the overall market
capitalization as well. Liquidity fell 37.1% in Q2, arguably “outperforming”
crypto asset prices. This benchmarking is important since liquidity on the
DEX is heavily impacted by the price of the underlying tokens. Even
benchmarked against ETH, liquidity still held up well in Q2. ETH fell almost
70% during the same time period. Part of the impact of liquidity holding up
can be attributed to stablecoins on the exchange, but overall, continued
yield-generating opportunities highlights the resiliency of blue-chip DEXs
like Uniswap as a vital service for a functioning DeFi ecosystem
Lower trading volume correlates with lower fees. Fees across all networks
were 21.9% lower compared to the previous quarter. However, Optimism
had a great quarter. Liquidity provider (LP) fees grew 146.9% from $1.4
million to $3.5 million over the last 90 days. A big boost came from the
much-awaited release of Optimism’s OP governance token. Other rollups
should take note of the effects of the airdrop: certainly in the short term,
attention shifted towards the L2, and transaction activity on the rollup saw a
large uptick.
Meanwhile, the largest decline of fees generated occurred in Arbitrum, the
other Uniswap L2 scaling solution. Fees fell 35.9% in the quarter down to $3.6
million. The end result is a much closer comparison between Arbitrum and
Optimism. Whereas fees earned on Arbitrum were four times as much as
on Optimism in Q1, the $0.1 million difference between the two in Q2 was
negligible, highlighting once again how impactful the OP airdrop was in the
L2 scaling wars. Whether Arbitrum launches a token — and how that
impacts trading on Uniswap — remains to be seen.
A gloomier macroeconomic environment, geopolitical uncertainty, and
institutional liquidation all contributed to one of the worst quarters in the
industry’s history. However, Uniswap’s continued facilitation of billions of
trading activity proves the decentralized exchange model is here to stay.
Now armed with an investment team and NFT marketplace aggregator,
Uniswap is strongly positioned to further root itself as a pillar of the crypto
economy.
also: Unpacking Uniswap’s ‘Fee Switch’
A governance vote could give UNI token holders a slice of the exchange’s transaction fees. So what’s stopping them?
I tend to prefer AAVE in this section of the crypto space...but that;s just an opinion.
One Love,
The FXPROFESSOR
UNI Update - Moving UpFollowing my previews idea. UNI had a good reaction in the box with a nice bounce.. I've marked some areas that I think price might find some resistance.
Do not follow my moves before you do your own research, These are ideas not financial advice,

Uniswap Further Bullish EmphasisVery similar scenarios to the beginning of Uniswap's price history, which was followed by a massive moonshot
I have posted about this before, this is for just emphasis on the bullish state (inverted H&S)

UNI IDEANot really following UNI but after a quick look, I think price action is really interesting. At the moment retracing - not sure how much, will it find a support around 8 area or is it going to bounce on the trend line? No clue. But if the whole market keeps pumping I think is possible that it goes up to 10.5 or even 12.
Keep an eye, losing the support of the trend line is not a good sign.
Let me know your thoughts :)
Don't join before you do your own research. This is a rough idea, NOT a financial advice.

UNIUSD - Will This Beast Surge Again?UNIUSD was king of DeFi in 2021 and since its wild surge has in 2021 has been in a bear market ever since. It didnt even make a corrective higher high with BTC.
It has just passed the 1.618 extension from the top and this is in the area of the only support block (circled) on the chart.
Weekly RSI oversold.
Good chance it bounces in this area with BTC.
Not advice.

UNI, 5 waves rose.The following are machine translations:
The daily chart, along the trend line, rises in 5 waves. The 5th wave is in progress. Compared with the long upper shadow line on the left, the fairy guides the way, and looks around 10.
The indicator macd formed a golden cross again above the zero axis, showing a strong performance. The RSI indicator is running in bullish territory above neutral 50.
The operation is low and much, you can try to start near 7.5, and the target is near 10.


Uniswap to hit $5.20Uniswap to hit $5.20
****
The Uniswap (UNI) pattern broke above the monthly resistance at $6 under the influence of an inverse head and shoulders chart pattern. Hence, coin buyers are developing another pillar to climb further up the price chart. Additionally, the technical setup of this bullish reversal pattern should encourage buyers to rally the bulls to $8. you should enter
For almost two months, I. H. From May 11 to July 8, the UNI/USDT pair traded sideways, struggling to clear the $6-$5.9 resistance. Furthermore, this consolidation has formed an inverted head and shoulders pattern, which offers traders a chance for recovery.
The recent drop in UNI price has stabilized around $4.65, forming the right shoulder of the pattern. The corrected rally sent the altcoin surging 40% and breaking the neckline resistance at $6.
On July 9, the coin saw a decisive breakout from $6, supported by a significant increase in trading volume. Additionally, the altcoin, which is currently in the retest phase, provides an entry point for contrarian buyers.
Alternatively, the impact of the $6 support level would nullify the bullish thesis and trigger another correction in UNI price.

UNI - Leading The Crypto Bull Run! 🚀UNI has broken above resistance with impulse as can be seen well on the daily chart.
Last bull market it was UNI that surged hard and long in the early stages and I think this may happen again.
It may re-test, it may even fall back below resistance, but I think in a week, in a month, in 3 months UNI will be well on the way to the moon, or at least a retracement moon 😄🌒.
Not advice.

UNIUSD ❕ upper boundary of channelUNI is moving in an uptrend channel, but is now near the upper boundary.
TD Sequential has formed a reversal signal down (1H TF)
Price and RSI have formed a bearish divergence (1H TF)
I expect price to correct after fixing under resistance level.

UNI faces bearish crossover after failing to test $5.68 resistanUniswap price analysis remains bearish today, following from yesterday’s massive 16 percent decline that took price down to $5.25 support. UNI declined more than 2 percent over the past 24 hours to as low as $5.36 with trading volume rising above 55 percent. Uniswap price took a sudden correction on July 10, 2022, after facing rejection at the $6.38 resistance point and is now set for a bearish crossover. Price could find an uptrend if buyers come into the market at discounted price over the current trend, but would need to look out for the high volatility currently in place. UNI market cap fell around 3 percent today, moving down to $4,195,369,658.
The larger cryptocurrency market continued to decline sharply from yesterday, as Bitcoin receded down below the crucial $20,000 mark with a 4 percent decline. Ethereum lost 7 percent in price to stay just above $1,000, while major Altcoins showed similar downtrends. Cardano dropped 4 percent to $0.43, whereas Ripple dropped 3 percent to $0.31. Dogecoin dropped down to $0.06 with an almost 5 percent dip, while Solana showed a similar decline to move down to $33.88. Meanwhile, Polkadot moved down to $6.78, dropping 2 percent over 24 hours.

UNISWAP LongWait, Uniswap is breaking out ? curious what will happen in a couple of days/weeks. A close above the horizontal line, could lead the price up.
If this plays out well, my price target will be at 10,812.


UNI - Profit Taking AgainUNI is hitting a clear 1:1 here with some wick while BTC has a flash mini potential blow off top so im taking some profits here.
I'll be looking to re-enter my swing at the log 0.382 which is $5.39.
It may (I think) get to the 1.272 but even if it does and reverses then a 0.382 is still lower than current price at $5.54.
Some bearish divergence also on the 1H.
Also NDX hitting resistance so I'm expecting a down day tomorrow which can also pull crypto down so it would be approriate time for BTC to top if thats correct.
Most of the other coins i'm leaving alone unless they have clear fibs and I cant be doing with too much fiddle.
Not advice.

UNI/USDhi everybody and hope you are good
this is Update for my last post about uniswap and show some targets to you
today it pass over 50% of my path line .sooo wait for the main target
follow me for more analysis and share your comments for me

UNI/USDhi everybody
my idea about UNISWAP, the price goes Up to 5.2 $ in the first Target.in the secend one its goes to 6$
SL is around 4.5
follow me for more
share your comments

UNI - Profit TakingI'm exiting my swing position here but not touching my hodl allocation.
Currently UNIis up 50% from my entry.
It is hitting the range top.
Bearish divergence on 4H RSI .
And most importantly BTC is in a drifting ascending channel - looking ready to fall.
I'll hopefully get back in near the low. If I miss it its fine i'll put it in something else but I think the odds favour the exit.
Not advice.
