UNIUSD (Daily) Bullish reversalHi Traders
UNIUSD (Daily Timeframe)
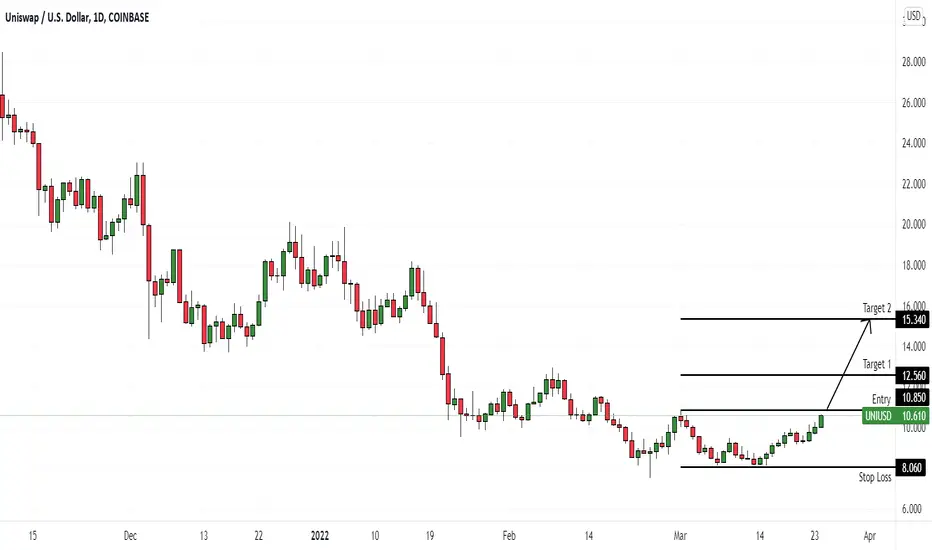
Waiting for the upward break of 10.850 resistance level, which will complete a bullish trend reversal pattern to go LONG. Only the downward break of 8.060 would cancel the bullish scenario.
Trade details
Entry: 10.85
Stop loss: 8.06
Take profit 1: 12.56
Take profit 2: 15.34
Score: 5
Strategy: Bullish reversal
UNIUSD trade ideas
UNI greater than 6% bullish target identifiedToday I'm posting not just an individualized idea but an idea that combines multiple coins. As you all know from my recent posts, I expect BTC /ETH to experience a short-term wave down. I worked extra hard tonight to find a basket of coins that could yield us the > 3% per day that I'm going for. These coins follow the momentum trend inversion calculations and target calculations that I've perfected over the years. Some of these coins might not go up as much as a basket, but I expect an easy 3% gain combined within 24hrs.
Here are the coins.
Coin TP-Target %-Allocation
GALA 6.50% 11.29%
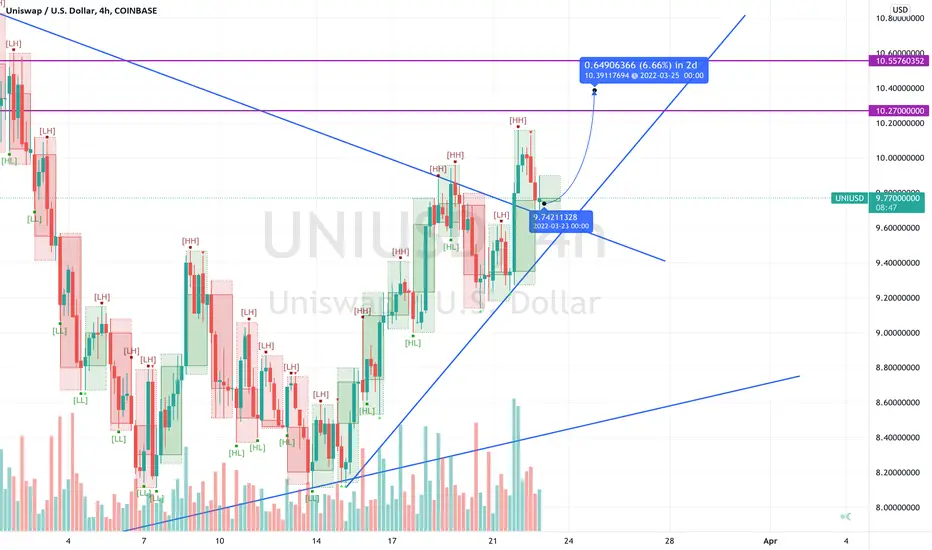
UNI 6.60% 8.06%
ENJ 6.60% 6.45%
ACH 15% 11.29%
MATIC 5% 8.06%
SHIB 8% 9.68%
MANA 5% 11.29%
KNC 7% 14.52%
JASMY 12% 14.52%
------------
I'm really enjoying being back in Crypto and interacting with my followers. Thank you for following me and for your support and encouragement. If you have enjoyed making money with my highly accurate and high probability ideas over the last couple of days, please like, follow, comment, and tell your friends and family. I make daily posts, so don't miss out on the next trade. I'm also making significant improvements to the trading system, and you can expect only even higher probability ideas with improved accuracy on timing and with probability.
Please keep in mind that I'm not a financial advisor. Trade at your own risk.

Uniswap Hi everyone let's discuss Uniswap crypto,first the chart has been bearish for some time and recently its forming bullish patterns like head and shoulders upside down.This includes some support areas that for being confirmed
In H4 we can see that we are currently in a falling wedge which is a good indication for long....
Let me know on the chat what you think.

HOWTOCRYPTO 101 uniswap editionjust another how to crypto long term chart
not using any particular indicators just a how too

UNI recovers above $8.2.The UNI was on a bearish slide as bears decreased the price from $10.5 to $8.2 during the last week, as the trend remained downwards for the entire week.
UNI found support and is covering range upwards, and the price has been recovered up to $8.52, which is a good achievement in a current bearish market.
The next resistance for UNI is present at $8.9, where selling pressure is expected to kick in again. The trading volume has increased by 21 percent over the last day, which has resulted in price recovery and an increase in market cap by 3.7 percent.
The 24 hours Uniswap price analysis shows an increase in price today after a continuous week of bearish practice. Overall, UNI is at a loss of 17.8 percent over the entire last week. Generally, the entire month proved unfruitful for the crypto asset as it saw a substantial loss with very few increments in coin value. However, today’s trend is upwards, and the coin reports an increase of 3.4 percent in price as the price has recovered to $8.5 today.
The volatility has been high, and the Bollinger bands are expanded, with the upper band present at the $10.7 mark and the lower band present at the $7.9 mark. The average of Bollinger bands is at the $9.32 level. The moving average is at the $9.28 mark below the SMA 50. The relative strength index is trading in the lower half of the neutral zone at index 38 but is now on an upward trend.
The 1-day Uniswap price analysis is indicating bullish signs for the cryptocurrency, as overall, the crypto market is recovering today so is UNI. We expect UNI to continue upside for the next 12 hours to retest the $8.9 resistance.

Uniswap (UNI) - March 5Hello?
Traders, welcome.
If you "follow", you can always get new information quickly.
Please also click "Like".
Have a good day.
-------------------------------------
(UNIUSD 1W Chart)
If it falls below the 8.7501025 point, it is expected to enter the mid- to long-term investment area, so careful trading is required.
However, as you get closer to the 3.7782994 point, you need to check whether it rises with a sharp movement.
In order to switch to an uptrend, it should rise near the 18.4183529-20.1260254 section.
It is expected that the price of altcoins will either move sideways or fall before Bitcoin turns into an uptrend and shows signs of consolidation.
Therefore, if you are unfamiliar with short-term trading, we do not recommend trading altcoins.
This is because the rise of altcoins is expected to continue as Bitcoin's dominance () rises to near the 48.81 point and then declines.
-------------------------------------
(UNIBTC 1W chart)
You need to make sure you can get support near the 0.0001 81 - 0.0001 381 section.
To switch to an uptrend, it should rise near the range 0.0003 773 - 0.0004 076.
------------------------------------------
We recommend that you trade with your average unit price.
This is because, if the price is below your average unit price, whether the price trend is in an upward trend or a downward trend, there is a high possibility that you will not be able to get a big profit due to the psychological burden.
The center of all trading starts with the average unit price at which you start trading.
If you ignore this, you may be trading in the wrong direction.
Therefore, it is important to find a way to lower the average unit price and adjust the proportion of the investment, ultimately allowing the funds corresponding to the profits to be able to regenerate themselves.
------------------------------------------------------------ -----------------------------------------------------
** All indicators are lagging indicators.
Therefore, it is important to be aware that the indicator will move accordingly as price and volume move.
However, for convenience, we are talking in reverse for the interpretation of the indicator.
** The MRHAB-O and MRHAB-B indicators used in the chart are indicators of our channel that have not been released yet.
(Since it was not disclosed, you can use this chart without any restrictions by sharing this chart and copying and pasting the indicators.)
** The wRSI_SR indicator is an indicator created by adding settings and options to the existing Stochastic RSI indicator.
Therefore, the interpretation is the same as the traditional Stochastic RSI indicator. (K, D line -> R, S line)
** The OBV indicator was re-created by applying a formula to the DepthHouse Trading indicator, an indicator disclosed by oh92. (Thanks for this.)
** Support or resistance is based on the closing price of the 1D chart.
** All descriptions are for reference only and do not guarantee a profit or loss in investment.
(Short-term Stop Loss can be said to be a point where profit and loss can be preserved or additional entry can be made through split trading. It is a short-term investment perspective.)
---------------------------------

UNI/USD Swing Trade BuySupport at 10.31 was previously strongly held on the Daily time frame and was lost upon the initial market reaction to Russia's invasion of Ukraine. Upon news that Russians are finding means of avoiding the sanctions through cryptocurrency, price action surged and is aiming to reclaim this level of support in addition to the Daily 20 EMA and flip trend resistance into support (both of which it had previously rejected twice). If successful, this would be an ideal R/S flip and generally a solid area to enter a position, also considering that the Daily 20 EMA and Trend Line support meet for confluence.
Weary of the .618 fib level (drawn from the short-term High: 12.94 and Low: 7.5), this would also have to be reclaimed to further establish a bullish perspective and can generally also be a more conservative level of entry. Alternatively, there is the potential for a rejection from this level. In saying this however, the bullish divergence on the RSI indicator could indicate underlying buying-pressure which could be the volume needed to reclaim this level and head towards the 50 EMA , which had been rejected 3x previously as depicted in the chart, so a close above the 50 EMA would be required to breeze through free-air until heavy resistance in the zone around 14.10. Alternatively, price can reject off the 50 EMA and retest the .618 fib level.
A remaining wick down to 9.51 still lingers in the background and also falls in line with the .382 fib ratio. So with sustaining a risk/reward ratio of 5.6, a stop loss at 9.32 should suffice for any wicks down to wipe out traders or retest trend line support.
A fundamental catalyst to a coin such as UniSwap specifically could be fuelled by the requests from the Ukrainian Vice Prime Minister to Crypto exchanges Binance, Kraken, and Coinbase to block and freeze all Russian crypto exchange accounts. Although they refused, cryptocurrency is a market of speculation, and the fact that the availability of 'decentralised finance' has the potential to be cherry-picked to different countries by centralised exchanges, could call for a stronger attraction to and reiteration for the need of Decentralised Exchanges such as Uniswap to be utilised for the motive of DeFi. Among others such as Pancakeswap, Sushiswap, and Curve, Uniswap is one of the most popular decentralised exchanges in the crypto atmosphere.
easyMarkets Account on TradingView allows you to combine easyMarkets industry leading conditions, regulated trading and tight fixed spreads with TradingView's powerful social network for traders, advanced charting and analytics. Access no slippage on limit orders, tight fixed spreads, negative balance protection, no hidden fees or commission, and seamless integration.
“Any opinions, news, research, analyses, prices, other information, or links to third-party sites contained on this website are provided on an "as-is" basis, are intended only to be informative, is not an advice nor a recommendation, nor research, or a record of our trading prices, or an offer of, or solicitation for a transaction in any financial instrument and thus should not be treated as such. The information provided does not involve any specific investment objectives, financial situation and needs of any specific person who may receive it. Please be aware, that past performance is not a reliable indicator of future performance and/or results. Past Performance or Forward-looking scenarios based upon the reasonable beliefs of the third-party provider are not a guarantee of future performance. Actual results may differ materially from those anticipated in forward-looking or past performance statements. easyMarkets makes no representation or warranty and assumes no liability as to the accuracy or completeness of the information provided, nor any loss arising from any investment based on a recommendation, forecast or any information supplied by any third-party."

Uniswap Price Analysis — February 28UNI has traded in an overall bullish pattern over the past four days but continues to stall around the psychological $10.00 mark as the broader market regains upward mobility.
The cryptocurrency rebounded sharply a few hours after the Russian invasion announcement by Putin last week, which saw the entire crypto market shed hundreds of billions of dollars within a short period. Unlike most other coins, UNI did not stay subdued long following Thursday’s sell-off and had rallied by over 30% ever since.
That said, a clean break above the $10.00 mark over the coming hours should help UNI attack the critical $11.00 resistance, where my descending trendline resides. With a rich macroeconomic data docket for the week, I expect to see some fiery price action in UNI this week.
Meanwhile, my resistance levels are $11.00, $12.00, and $13.00, and my support levels are $9.00, $8.00, and $7.00.
Total Market Capitalization: $1.79 trillion
Uniswap Market Capitalization: $6.88 billion
Uniswap Dominance: 0.38%
Market Rank: #22

UNI, the shock market.The following content is machine translation:
Grab the range-bound oscillating band.
In the 4-hour chart, it stepped back to the trend line and stopped falling.
The trend line stopped falling and looked for a rebound.
Above resistance near 14.5.
In operation, it can be more, stop loss below the trend line, and take profit near the resistance level.

Uniswap DailyDownside of uni still to come, red is still in play if we go furhter. Yellow is price target for once we get past the previouse ATH

UNIUSD (4H) Bullish reversalHi Traders
UNIUSD (4H Timeframe)
Waiting for the upward break of 12.05 resistance level, which will complete a bullish trend reversal pattern to go LONG. Only the downward break of 9.95 would cancel the bullish scenario.
Trade details
Entry: 12.05
Stop loss: 9.95
Take profit 1: 13.19
Take profit 2: 15.15
Score: 4
Strategy: Bullish reversal

UNIUSD D1 a good opportunity to BUY Hello traders this is my analysis about UNIUSD D1
This analysis made by Classic Elliot Wave and price action
I counted major wave 1 with labels and also wave 2 as you see it is a zigzag and I think we are at the end of wave c from this zigzag and also we see a Falling wedge classic pattern too So I expect rising for the price of this currency with determined targets . I will update this analysis .
If the price break current support level this analysis will be fielded

Is Uni down going down?Honestly I'm not really sure, but something about market conditions and these fib bands and supports lining up makes me think that it just might be.
Youll see on the chart I have 2 fib retracements drawn, I really don't know which one best fits, guess well have to wait and see.

UniswapUni Swap goes up to $ 16 Sell a significant resistance of $ 14, which is likely to hit a few to reject it.

UNISWAP: KEEPING THE SUPPORTUni is a great project, I bought some at the end of the year, now I think it is appropriate to see if the support holds and then to think for a second entry.

Uniswap (UNI) Undervalued Will Be Back Over $20A lot of DeFi 1.0 and decentralized exchanges have been in the gutter for the past couple months and Uniswap is no exception. Uniswap has been trading below the 0.236 Fibonacci level since early December and it's only a matter of time before it starts to climb to the 0.236 Fibonacci level at $20. Uniswap is the second largest Decentralized Exchange when it comes to Total Value Locked (TVL) and has recently deployed on the Polygon (MATIC) ecosystem.
Once market sentiment moves back into greed from extreme fear I do see Uniswap ultimately reaching back to the 0.382 Fibonacci level of $25.29 which is also were the the Point of Control (POC) is at on the Visible Range Bars. A lot of price interaction with Uniswap has occurred over $20.
As of right now Uniswap is undervalued. Support Area is from $13.00 - $14.20. Much peace, love, wealth, and health.

Uniswap trade ideaThis is a quick trade idea.
Uniswap seems to have a double bottom, could hit 18 and 20$ on a short term crypto bounce.
I am still bearish on crypto right now so this is risky.
Using tight stop loss like 15.85 area.
DYOR.

UNIUSD Falling WedgeFalling Wedges usually result in bull breakouts
The yellow bars pattern placed is very speculative. Just assuming that once price breaks out of the formation, bulls will dominate.

UNIUSD Higher LowUNI is current showing strength for a solid upside move, and BTC is indicating seller exhaustion at that $40,779 area. Thus, I took a long on UNI.
Entry: $15.42
Stop: $13.40
1st Target: 61.8% retrace
2nd Target 78.6% retrace
3rd Target: $29

Will this be the next UNI cycle ?I've been really enjoying these near perfect Autumn days here in Western Australia. Away from the charts chillaxing with family must be on the top of the list for me these days. BUT looking forward to finding some good investments. This one comes from "ich1baN" look him up and buy him a beer. As he has mentioned, great potential earnings for UNI, so I thought I would do a quick analysis. Everything Stoch, RSI , 100 and 200 EMA's are all green. Candles showing the classic Forex pre-pump arch. I'm looking to buy in the orange zone on the 2hour. Also, there are channels within channels ... Looking to ride this rapid to see where it takes me.

UNIUSD (Daily Timeframe)Hi Traders
UNIUSD (Daily Timeframe)
Waiting for the upward break of 19.96 resistance level, which will complete a bullish trend reversal pattern to go LONG. Only the downward break of 16.70 would cancel the bullish scenario.
Trade details
Entry: 19.96
Stop loss: 16.70
Take profit 1: 21.90
Take profit 2: 25.10
Score: 4
Strategy: Bullish reversal

UNIUSD Long with tight stopThere is a potential higher low on UNI. This is after the bullish divergence played out. Thus, I'm only hoping for bullish convergence here. BTC might be painting a bullish engulfing candle, and ETH is currently showing seller exhaustion. I believe the potential H&S on UNI will be invalidated and we'll see higher prices.
If not, I have a tight stop loss.
Entry $17.33
Target: $27
Stop: $16.65
