lesson learnedi need to just forget about the trade after i place it. doesn't matter what happened, don't ever move the orders again. i will not mess myself up, missed a lot of profit for the last two trade
UNIUSDT trade ideas

You are UNI! Not UNIC!I mean you are unique!! But this is more unique in its place and we see the moves to be more more more precendented!

Wednesday giving a 3 days of breakout signalWednesday giving a 3 days of breakout signal. 3 days of breakout is a strong signal, Wednesday is typically the reversal point of the week. let see, if it works .just hold till it hit tp or sl. not even bothered to move sl to Breakeven. that is the plan

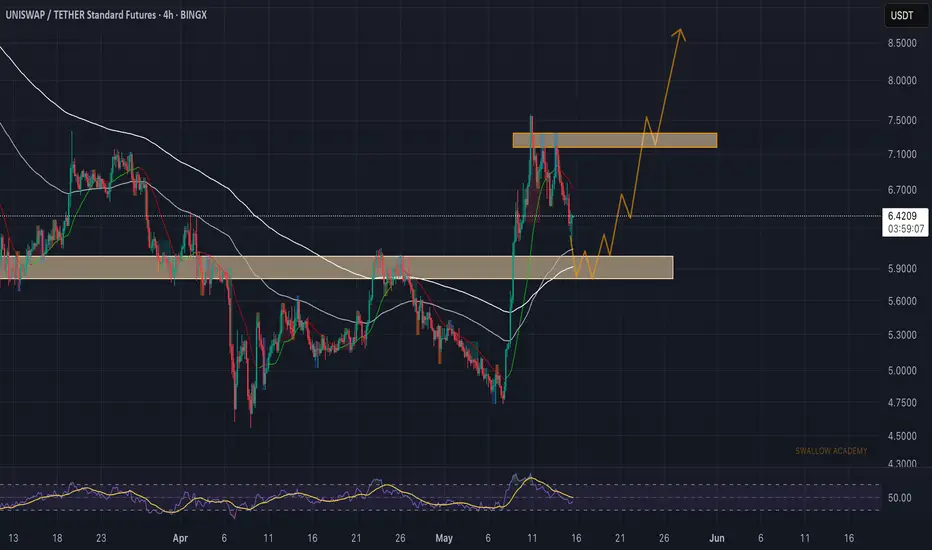
Uniswap (UNI): Looking For Successful Re-Test | Bullish MovementUNI coin is approaching the local support zone near the 200EMA, where we had a nice breakout but lacked the proper retest of that zone. We are looking for a successful retest of that zone, which would then open us an opportunity to move back to upper zones, towards the smaller resistance zone (for a breakout).
Swallow Academy
UNIUSDT Cryptocurrency Futures Market Disclaimer 🚨🚨🚨
Trading cryptocurrency futures involves high risks and is not suitable for all investors.
Cryptocurrency prices are highly volatile, which can lead to significant gains or losses in a short period.
Before engaging in crypto futures trading, consider your risk tolerance, experience, and financial situation.
Risk of Loss: You may lose more than your initial capital due to the leveraged nature of futures. You are fully responsible for any losses incurred.
Market Volatility: Crypto prices can fluctuate significantly due to factors such as market sentiment, regulations, or unforeseen events.
Leverage Risk: The use of leverage can amplify profits but also increases the risk of total loss.
Regulatory Uncertainty: Regulations related to cryptocurrencies vary by jurisdiction and may change, affecting the value or legality of trading.
Technical Risks: Platform disruptions, hacking, or technical issues may result in losses.
This information is not financial, investment, or trading advice. Consult a professional financial advisor before making decisions. We are not liable for any losses or damages arising from cryptocurrency futures trading.
Note: Ensure compliance with local regulations regarding cryptocurrency trading in your region.
thanks for like and follow @ydnldn

UNI/USDTKey Level Zone: 7.620 - 7.680
LMT v2.0 detected.
The setup looks promising—price previously trended upward with rising volume and momentum, then retested this zone cleanly. This presents an excellent reward-to-risk opportunity if momentum continues to align.
Introducing LMT (Levels & Momentum Trading)
- Over the past 3 years, I’ve refined my approach to focus more sharply on the single most important element in any trade: the KEY LEVEL.
- While HMT (High Momentum Trading) served me well—combining trend, momentum, volume, and structure across multiple timeframes—I realized that consistently identifying and respecting these critical price zones is what truly separates good trades from great ones.
- That insight led to the evolution of HMT into LMT – Levels & Momentum Trading.
Why the Change? (From HMT to LMT)
Switching from High Momentum Trading (HMT) to Levels & Momentum Trading (LMT) improves precision, risk control, and confidence by:
- Clearer Entries & Stops: Defined key levels make it easier to plan entries, stop-losses, and position sizing—no more guesswork.
- Better Signal Quality: Momentum is now always checked against a support or resistance zone—if it aligns, it's a stronger setup.
- Improved Reward-to-Risk: All trades are anchored to key levels, making it easier to calculate and manage risk effectively.
- Stronger Confidence: With clear invalidation points beyond key levels, it's easier to trust the plan and stay disciplined—even in tough markets.
Whenever I share a signal, it’s because:
- A high‐probability key level has been identified on a higher timeframe.
- Lower‐timeframe momentum, market structure and volume suggest continuation or reversal is imminent.
- The reward‐to‐risk (based on that key level) meets my criteria for a disciplined entry.
***Please note that conducting a comprehensive analysis on a single timeframe chart can be quite challenging and sometimes confusing. I appreciate your understanding of the effort involved.
Important Note: The Role of Key Levels
- Holding a key level zone: If price respects the key level zone, momentum often carries the trend in the expected direction. That’s when we look to enter, with stop-loss placed just beyond the zone with some buffer.
- Breaking a key level zone: A definitive break signals a potential stop‐out for trend traders. For reversal traders, it’s a cue to consider switching direction—price often retests broken zones as new support or resistance.
My Trading Rules (Unchanged)
Risk Management
- Maximum risk per trade: 2.5%
- Leverage: 5x
Exit Strategy / Profit Taking
- Sell at least 70% on the 3rd wave up (LTF Wave 5).
- Typically sell 50% during a high‐volume spike.
- Move stop‐loss to breakeven once the trade achieves a 1.5:1 R:R.
- Exit at breakeven if momentum fades or divergence appears.
The market is highly dynamic and constantly changing. LMT signals and target profit (TP) levels are based on the current price and movement, but market conditions can shift instantly, so it is crucial to remain adaptable and follow the market's movement.
If you find this signal/analysis meaningful, kindly like and share it.
Thank you for your support~
Sharing this with love!
From HMT to LMT: A Brief Version History
HM Signal :
Date: 17/08/2023
- Early concept identifying high momentum pullbacks within strong uptrends
- Triggered after a prior wave up with rising volume and momentum
- Focused on healthy retracements into support for optimal reward-to-risk setups
HMT v1.0:
Date: 18/10/2024
- Initial release of the High Momentum Trading framework
- Combined multi-timeframe trend, volume, and momentum analysis.
- Focused on identifying strong trending moves high momentum
HMT v2.0:
Date: 17/12/2024
- Major update to the Momentum indicator
- Reduced false signals from inaccurate momentum detection
- New screener with improved accuracy and fewer signals
HMT v3.0:
Date: 23/12/2024
- Added liquidity factor to enhance trend continuation
- Improved potential for momentum-based plays
- Increased winning probability by reducing entries during peaks
HMT v3.1:
Date: 31/12/2024
- Enhanced entry confirmation for improved reward-to-risk ratios
HMT v4.0:
Date: 05/01/2025
- Incorporated buying and selling pressure in lower timeframes to enhance the probability of trending moves while optimizing entry timing and scaling
HMT v4.1:
Date: 06/01/2025
- Enhanced take-profit (TP) target by incorporating market structure analysis
HMT v5 :
Date: 23/01/2025
- Refined wave analysis for trending conditions
- Incorporated lower timeframe (LTF) momentum to strengthen trend reliability
- Re-aligned and re-balanced entry conditions for improved accuracy
HMT v6 :
Date : 15/02/2025
- Integrated strong accumulation activity into in-depth wave analysis
HMT v7 :
Date : 20/03/2025
- Refined wave analysis along with accumulation and market sentiment
HMT v8 :
Date : 16/04/2025
- Fully restructured strategy logic
HMT v8.1 :
Date : 18/04/2025
- Refined Take Profit (TP) logic to be more conservative for improved win consistency
LMT v1.0 :
Date : 06/06/2025
- Rebranded to emphasize key levels + momentum as the core framework
LMT v2.0
Date: 11/06/2025
- Fully restructured lower timeframe (LTF) momentum logic
Uniswap (UNI): Buyers Showing Strong Dominance | Aiming at $8.50Uniswap is showing strong buyside momentum where recently near 100EMA we saw how dominant the buyers were, which is giving us a sign of possible further movement to local resistance area, so that's where we have set our targets as of now.
Now if we see any signs of weakenss then we will be shifting our view for Bearish CME.
Swallow Academy

UNI - Is it Unique?So getting on UNIUSDT - It looks like a tokyo session move and a liqsurge, opting for the downmoves!

Almost thereLet see if it will hit to today, been more than 24hrs since the entry.i want to move my stop to lock in profit but I don’t know if I should…sometime you just don’t have the answer

looking good so farall i can do right now is pray lol. nothing to do after the trade is placed, the setup happens over 3 days and not it's time to dump back down


Uniswap UNI price analysis🦄 Despite the weak crypto market, #UNI is holding up quite well at the moment, so you should take it "on a pencil".
At first, the “big money” are buying, and then the news will be rolled out.
🕯 The OKX:UNIUSDT chart shows increased trading volumes.
We wouldn't be surprised if in the coming days, when the market moves into a "range", the price of #UNI shoots up to $9.31 or even $11.21
💰 And globally - the price of $22 per #Uniswap token can still be considered a fairly modest forecast.
_____________________
Did you like our analysis? Leave a comment, like, and follow to get more

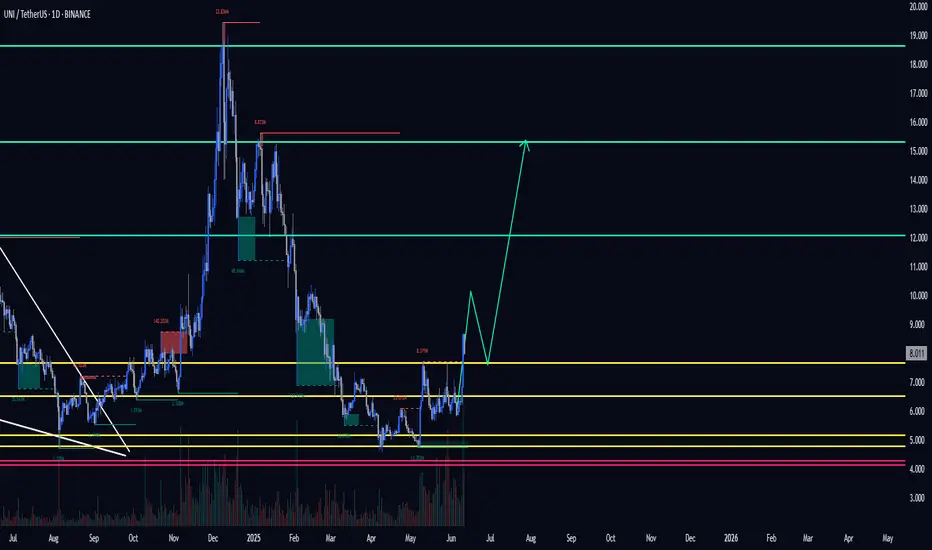
UNI is gearing up! Are you ready?Today, we’re going to discuss UNI and analyze the chart to identify the best possible scenario.
UNI/USDT has recently broken above the resistance trendline, showing a solid price acceleration from $6 to $8. If we take a closer look at the previous rally in November 2024, we’ll notice that the price stayed above the 50 EMA, maintained a gradual rally, and then surged all the way up to $19.5.
A similar pattern is emerging now — the price has broken above the 50 EMA after six months of a continuous downtrend and is now aiming for a potential 175% rally.
Here's the strategy to trade:
~ Entry: $7 to $7.6.
~ Trade type: Spot.
~ Period: Till July 2025.
~ Target: $15 to $18.
Note: Always do your own research and analysis before investing.

UniUSDT is ready to take offUniUSDT is ready to take off, and the momentum seems to have started now.

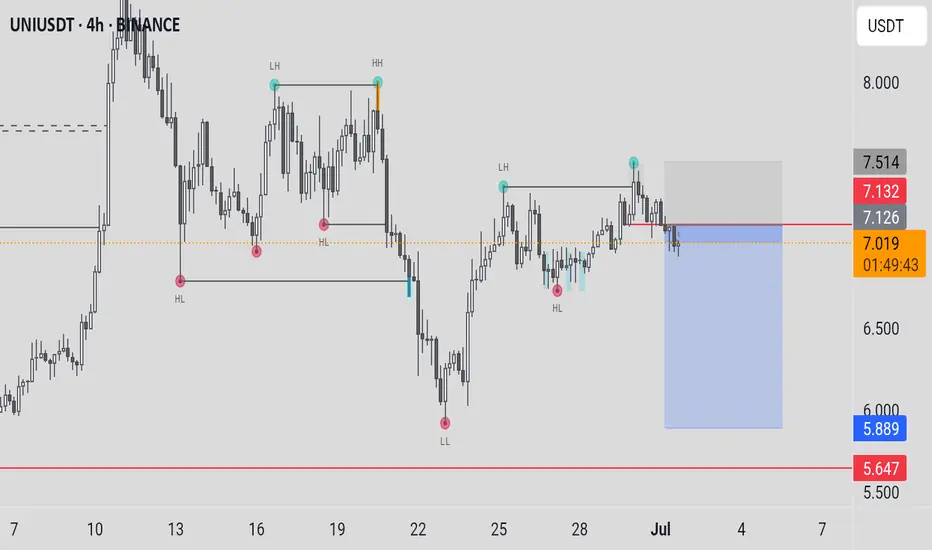
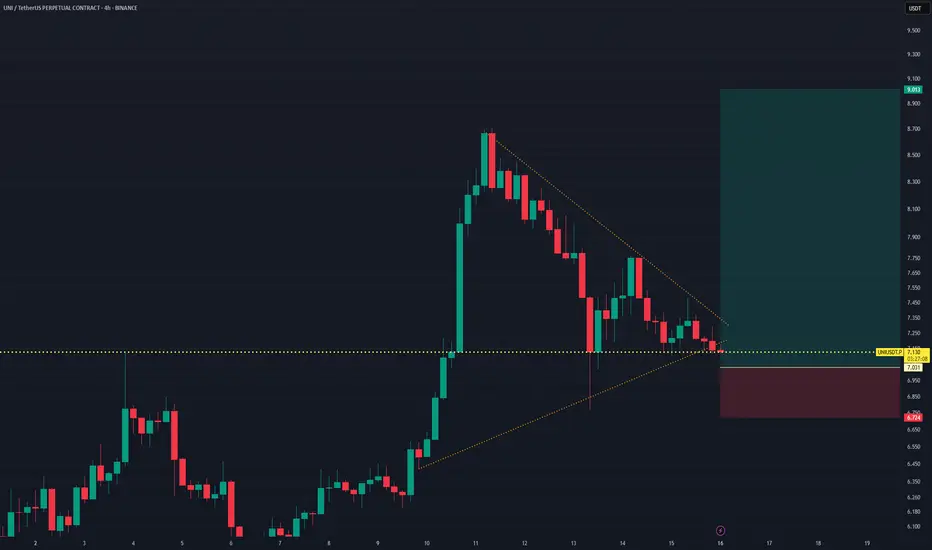
UNIUSDT Perpetual – Descending Triangle Breakout WatchUNIUSDT is currently testing the apex of a descending triangle pattern, with price compressing between a series of lower highs and a strong horizontal support near $7.13. This setup is a potential breakout trade in anticipation of bullish continuation.
Trade Details:
Position: Long
Entry: $7.137
Stop Loss: $6.724
Take Profit: $9.013
Pattern: Descending Triangle
Bias: Bullish Breakout
Setup Rationale:
Price has maintained key support despite downward pressure
A breakout above the descending trendline may trigger a bullish reversal
Volume likely to spike upon breakout confirmation
Risk-to-reward ratio is favorable if trade is executed at breakout with tight stop
Conclusion:
This is a breakout anticipation play. Should price break and close above the trendline resistance, it may initiate a strong upside rally toward the $9 region.
UNI to the Mooni - Unleashing Banking into DeFi - Send itUniswap has powered trillions of dollars of exchange volume over the years, but, while its achieved economies of scale, it's been held back from mainstream use and value accrual due to the existing banking system's de facto and now uncovered to be de jure prohibition on interaction and SEC's systematic administration by enforcement campaign to destroy on-chain freedom of choice in the new digital exchange economy.
How big does it in the age of when the President of the USA has launched his own coin? Now that every bank in the world is about to "plug-in" to our Matrix?
Bigger than you can possibly imagine. That's the answer old boy.
But first, send it to $35.
That's a Livermore Accumulation Cylinder by the way

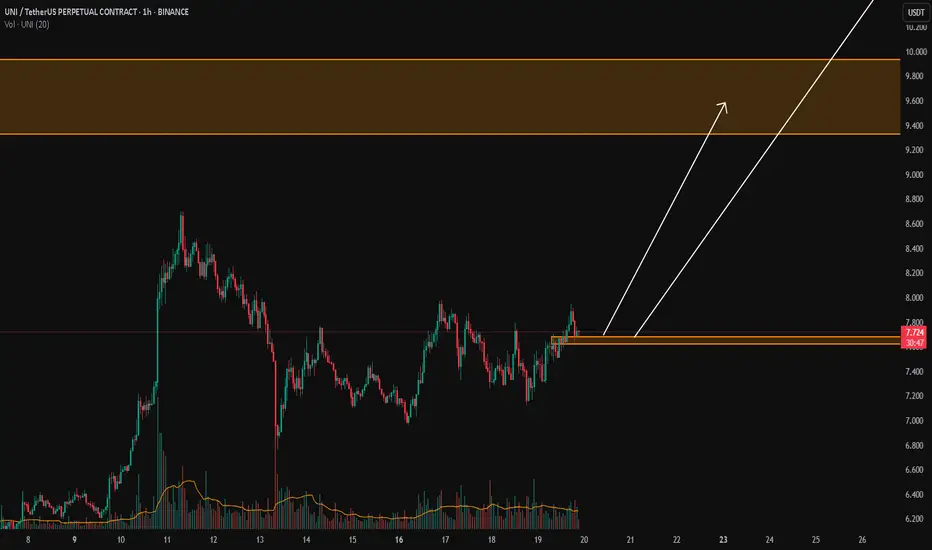
#UNI/USDT#UNI
The price is moving within a descending channel on the 1-hour frame, adhering well to it, and is heading toward a strong breakout and retest.
We are experiencing a rebound from the lower boundary of the descending channel, which is support at 7.78.
We are experiencing a downtrend on the RSI indicator that is about to be broken and retested, supporting the upward trend.
We are looking for stability above the 100 Moving Average.
Entry price: 7.85
First target: 8.19
Second target: 8.53
Third target: 8.85

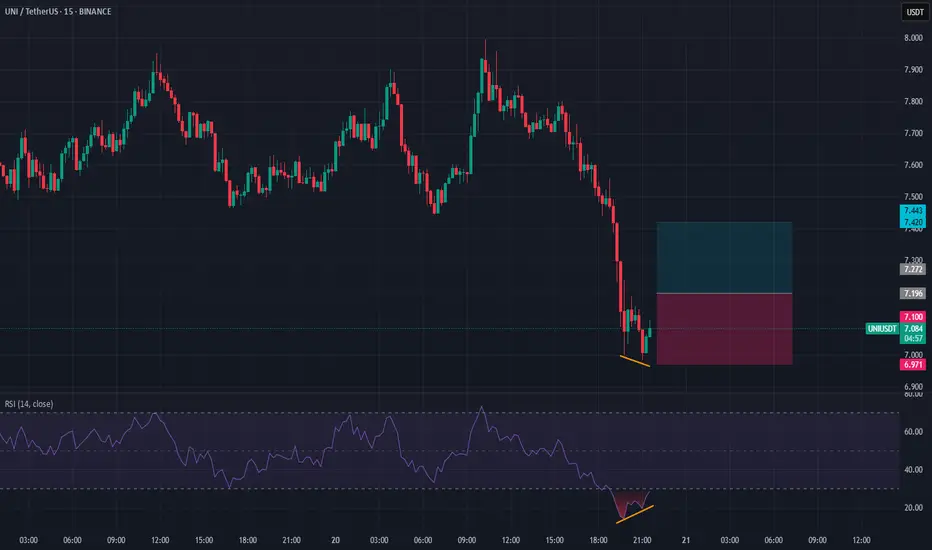
#UNI/USDT#UNI
The price is moving within a descending channel on the 1-hour frame, adhering well to it, and is heading for a strong breakout and retest.
We are experiencing a rebound from the lower boundary of the descending channel, which is support at 5.82.
We are experiencing a downtrend on the RSI indicator, which is about to break and retest, supporting the upward trend.
We are looking for stability above the 100 Moving Average.
Entry price: 6.15
First target: 6.53
Second target: 6.93
Third target: 7.33

UNI 1D. Breakout Coming? Long-Term Setup Explained 06/11#UNI has been trading in a wide range between $4.072 – $18.634 for the past three years. This is known as an accumulation phase, where large players may be building positions ahead of the next major price move.
After a steep decline, the price bounced off the key support zone at $5.623 – $4.753. It then reclaimed and held above $6.325, a historically high-volume area — a bullish signal.
For short-term entries, I recommend waiting for confirmation above the 100-week moving average (MA100), which currently sits around $7.671. A break and close above that level would suggest a trend reversal.
🎯 Targets:
• $12.063
• $15.305
📥 Mid-term accumulation zone:
• $5.623 – $4.753
• If price drops to $4.072, it could be another solid buy opportunity.
DYOR.
UNIUSDT Forming Bullish ReversalUNIUSDT is showing a classic bullish reversal pattern, marked by a clear W-shaped recovery, which is often a strong signal for trend reversal in crypto markets. The recent breakout has come with good volume support, further validating the strength of this move. The price action suggests a clean structure of higher highs and higher lows, indicating the start of a potential upward leg. Based on the pattern and momentum, we can expect a price gain in the range of 50% to 60% in the coming sessions.
From a technical perspective, this bullish formation aligns with an inverse head-and-shoulders structure, often seen at the end of prolonged downtrends. The price has reclaimed key resistance levels and is now consolidating above them, a sign that buyers are stepping in with confidence. The clear breakout candle and measured move projection both support the potential target range of $12 to $13 in the near term.
Fundamentally, UNI continues to be one of the most recognized names in the DeFi space, and growing ecosystem updates have attracted renewed interest from both retail and institutional investors. The recent uptick in trading volume and social media chatter surrounding UNI indicates rising momentum and strong investor sentiment. As the market rotates back into high-utility tokens, UNI is likely to remain in the spotlight.
For traders, keeping an eye on short-term pullbacks or consolidation zones around $8.00–$8.50 could offer ideal entries before the next breakout leg begins. Overall, UNIUSDT stands poised for a major bullish continuation if current market conditions persist and broader crypto sentiment remains positive.
✅ Show your support by hitting the like button and
✅ Leaving a comment below! (What is You opinion about this Coin)
Your feedback and engagement keep me inspired to share more insightful market analysis with you!

$UNI Breakout: 400% Target AheadCRYPTOCAP:UNI just broke out from its long-term accumulation zone around $4.000–$4.801, gaining +30% this week.
The market structure has turned bullish, with the next major target near $19–$24, a potential 400% upside.
As long as UNI holds above the breakout zone, further gains look likely.
Watch this one closely.
DYOR, NFA.
