One year dynamic resistance is powdered One year dynamic resistance has been powdered
One year dynamic resistance has been powdered
One year dynamic resistance has been powdered
Look at the chart :)
UNIUSDT trade ideas

UNI/USDT - Uniswap: Trend Reversal◳◱ On the $UNI/ CRYPTOCAP:USDT chart, the Trend Reversal pattern suggests indications that the trend may be gaining or losing strength. Traders might observe resistance around 12.758 | 14.116 | 16.637 and support near 10.237 | 9.074 | 6.553. Entering trades at 11.517 could be strategic, aiming for the next resistance level.
◰◲ General info :
▣ Name: Uniswap
▣ Rank: 23
▣ Exchanges: Binance, Kucoin, Bybit, Huobipro, Gateio, Mexc
▣ Category/Sector: Financial - Decentralized Exchanges
▣ Overview: Uniswap is a decentralized exchange built on Ethereum that utilizes an automated market making system rather than a traditional order-book. Instead of matching individual buy and sell orders, users can pool together two assets that are then traded against, with the price determined based on the ratio between the two.
◰◲ Technical Metrics :
▣ Mrkt Price: 11.517 ₮
▣ 24HVol: 15,682,647.271 ₮
▣ 24H Chng: 2.183%
▣ 7-Days Chng: -7.20%
▣ 1-Month Chng: -18.85%
▣ 3-Months Chng: 91.69%
◲◰ Pivot Points - Levels :
◥ Resistance: 12.758 | 14.116 | 16.637
◢ Support: 10.237 | 9.074 | 6.553
◱◳ Indicators recommendation :
▣ Oscillators: BUY
▣ Moving Averages: BUY
◰◲ Technical Indicators Summary : BUY
◲◰ Sharpe Ratios :
▣ Last 30D: -3.46
▣ Last 90D: 2.39
▣ Last 1-Y: 1.03
▣ Last 3-Y: 0.21
◲◰ Volatility :
▣ Last 30D: 0.85
▣ Last 90D: 1.35
▣ Last 1-Y: 0.91
▣ Last 3-Y: 1.08
◳◰ Market Sentiment Index :
▣ News sentiment score is N/A
▣ Twitter sentiment score is 0.59 - Bullish
▣ Reddit sentiment score is 0.77 - V. Bullish
▣ In-depth UNIUSDT technical analysis on Tradingview TA page
▣ What do you think of this analysis? Share your insights and let's discuss in the comments below. Your like, follow and support would be greatly appreciated!
◲ Disclaimer
Please note that the information and publications provided are for informational purposes only and should not be construed as financial, investment, trading, or any other type of advice or recommendation. We encourage you to conduct your own research and consult with a qualified professional before making any financial decisions. The use of the information provided is solely at your own risk.
▣ Welcome to the home of charting big: TradingView
Benefit from a ton of financial analysis features, instruments and data. Have a look around, and if you do choose to go with an upgraded plan, you'll get up to $30.
Discover it here - affiliate link -

#UNI/USDT#UNI
We have a bearish channel on a 4-hour frame, the price moves within it and adheres to its borders well at this price.
We have a fundamental support area at $10
We have a higher stability moving average of 100
We have a downtrend on the RSI that is about to break higher
Entry price is 11.16
The first goal is 11.96
Second goal 14.16
Third goal 16.00

UNI looks bullishUNI looks to be inside the bullish wave C. The degree of this wave is big and it is expected that this wave will continue for months.
The SWAP range is the right place for buy/long positions.
The targets are clear on the chart. Note that these targets are medium term.
Closing a daily candle below the invalidation level will violate the analysis
For risk management, please don't forget stop loss and capital management
When we reach the first target, save some profit and then change the stop to entry
Comment if you have any questions
Thank You

Uniswap(UNI): Looking For Major Breakdown!Uniswap seems more than sweet for a potential breakdown from current support zones.
If we get a clean breakdown, we will see a nice freefall, breaking both 100 and 200 EMA as well.
Swallow Team

Uni Fake Breakout of trend line ! Be aware ! UNI has been trading in a clear uptrend on the 4h timeframe. The price has been respecting the ascending trendline and making higher lows. However, the price is now approaching a strong resistance level at $13.
The ascending trendline:
The ascending trendline is a bullish pattern that is characterized by two converging trendlines, one connecting lower highs and the other connecting higher lows. The price typically breaks out above the upper trendline, signaling a continuation of the uptrend.
The resistance level:
The resistance level is a price level at which the price is likely to stop rising and start falling. This is because there are a large number of sell orders at this level.
The fakeout:
The fakeout is a bearish pattern that is characterized by a sharp increase in price, followed by a quick reversal and fall. This pattern is often used by large market participants to trap retail traders and acquire liquidity at higher prices.
The bullish scenario:
The price breaks out above the resistance level at $13 and continues to rise. The first bullish target is $20.
The bearish scenario:
The price fails to break out above the resistance level at $13 and falls back to the trendline. The price then retests the trendline and breaks down below it, signaling a reversal of the uptrend.
Conclusion:
The UNI chart shows a bullish pattern. The price is approaching a strong resistance level. The outcome of this level will determine the future direction of the price. Investors should always do their own research before investing in any cryptocurrency.

NFA only idea for me... Gambling...Consolidation ended. New HH will begin. All of these are my stupid wishes... :))

UNIUSDT LONG OUTLOOKHello Traders, this is outlook that i think might be work. All Entry, Stop Loss, and Take Profit its already showed up. All trade it is on yourself. DYOR.

UNIUSDT* DISCLAIMER, PLEASE ALWAYS DO YOUR OWN RESEARCH *
The information contained herein is for informational purposes only. I do not guarantee any particular outcome. Past performance does not indicate future results.

im bullish on UNIdaily 20/50/200 emas in order + broke the midpoint from this parallel channel on the daily and holding a retest
im hopefully getting out at 30ish unless i get stopped out

UNI is moving along the channelUNI is moving along the channel.
🔵Entry Zone 12.230 - 12.467
🔴SL 11.291
🟢TP1 13.387
🟢TP2 14.798
Risk Warning
Trading Forex, CFDs, Crypto, Futures, and Stocks involve a risk of loss. Please consider carefully if such trading is appropriate for you. Past performance is not indicative of future results.
If you liked our ideas, please support us with your likes 👍 and comments.

UNI/USDT descending channel assessing key resistance? 🚀UNISWAP 💎 Paradisers, pay attention as #UNIUSDT showcases an intriguing move. Following a descending channel, it's recently broken above and is now testing a critical resistance at $12.763. A successful breach of this resistance could significantly boost its chances for a bullish journey past this barrier.
💎 Amid market volatility, if $uniswap struggles to surpass the R1 resistance, we'll consider adjusting our approach. We're eyeing a bullish bounce from a lower support at $11.317, a level where the price has previously found footing.
💎 A drop below this key support level might signal a transition to a more pronounced bearish phase, accompanied by heightened selling activity. Maintaining alertness and flexibility is essential as we monitor the #UNI market's shifts.
UNI USDTUNI Setup. After a confirmed breakout from the marked zone in green, we could take an entry at 13.152. Remember stop loss is your friend. Everything is on the chart.
Entry 13.152
S.L 12.095
T.P 1 13.933
T.P 2 15.207
T.P 3 16.975

Uniswap (USDT) showing bullish scenario on 3Day TFBullish for Uniswap USDT because of following reasons:
1) Positive Reversal Divergence on 3day Timeframe
2) Already in uptrend
3) Above 20 MA of Bollinger bands
4) Rejection candle from 50% Retracement level

UNI Price UpdateThe price is testing the horizontal support level, and if it holds above, it's a bullish sign. However, if the candle closes below this support, it could indicate a possible market correction.

Is UNI's next target $26?Hello everyone!
I suggest paying attention to the #UNI token on the UNISWAP DEX.
On the chart, it is clear that after the last bullish market, a correction has started, forming a 3-wave Elliott correction structure.
Currently, according to the plan, we are in the first impulsive wave of growth. The asset has already successfully held above strong Fibonacci levels and even reached the target level of 0.618, from which the correction began.
You can consider entering a position from the current price values or place buy orders from the 0.5 Fibonacci level.
Target - $25.91
The final profit is over 100%. It depends on where you open the position from.
This is not financial advice, everything you do is at your own risk!
Follow me to get even more trading ideas!

UNI Potential Bullish PatternAs you can see in the chart above, Uniswap has found support in a previously significant price range, around $12.70. In addition to that, the 4h chart appears to be making a bull flag pattern in this pullback, and the price has also pulled back into a significant fibonacci area, between the .5 and the .618. These indications could mean that wave 5 is coming soon. In the short term, I will be looking for a break above the top trendline on this chart to be fully bullish, and a break below the $12 level as a bearish sign. My price target if it ends up running would be the $20 range, or the fib 1.272. Good luck!

UNIUSDT - where to buyhi traders
UNIUSDT is correcting together with the rest of the market.
As we're preparing this trading idea, we are getting a bearish engufling candle on weekly time frame which most likely will imply further downtrend.
where to buy?
5 $ and 3,90 $ is where we're going to add Uniswap to our portfolio.
2 possible scenarios are shown on the chart

Uniswap Coin(UNI): Waiting For Buy ? Uniswap coin is looking sweet for some movement towards both 100 and 200 EMAs.
After a pushy movement on this coin, the price has been moving more sideways here with a slight downward push, which resulted in a tight gap on Bollinger Bands (which again suggests that a potential sharp movement is coming).
Considering all that, we see a high chance of EMAs being grabbed from where we would be looking for a potential buy zone 😉
Swallow Team

UNI 1HHi all , this is my opinion about UNI/USDT in 1H .
This is not signal for buy or sell .
I like to see your comments and opinion about this one .
Thank and good luck.

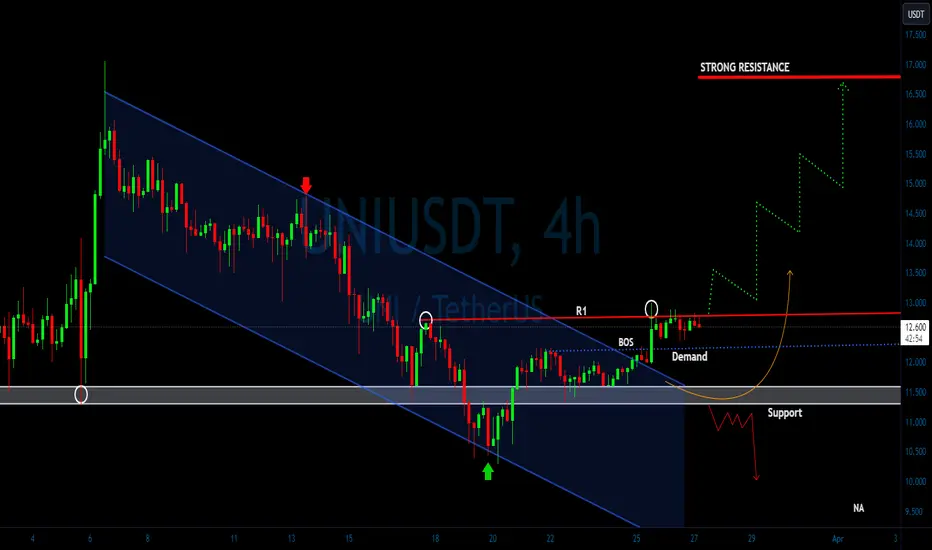
UNI/USDT Break Alert!! Indicating Continue upward Movement!💎 UNI has recently encountered significant market dynamics. Currently, UNI has successfully broken out the supply area.
💎 There may be a retesting phase at the demand area, which was previously the supply area, before continuing its upward movement and reaching our target area.
💎 During the retesting phase, it is crucial for UNI to bounce from the demand area if it intends to sustain its upward movement. However, if UNI fails to maintain the demand area, there is a possibility of a breakdown below the support area, leading to a return to lower price levels.
💎 At the support area, it is imperative for UNI to bounce and reclaim the area above the resistance for continued upward movement. Failure to do so could signal a bearish trend for UNI, potentially leading to further downward movement in price.

UNIUSDT - Lookin Good!Uniswap could be a sleeper large cap....
UNI has a measured move to the previous All Time High at around 200%!!!
Keep an eye on this as it could run hard if Bitcoin goes to $80K +
Lots of sleeper cryptos on my watch list!!!
#YouGotToBeAware
#GoodLuckOutThere
#UniSwap
#Crypto
#Bulllish

