$UNIUSDT: Uniswap is ready to rally from here#Uniswap V4 looks promising:
Custom AMM with Gas savings & Potential UNI Rewards
Developer-friendly: Build novel pool types & features like TWAMM, dynamic fees, on-chain limit orders.
Super efficient: Single smart contract slashes gas costs.
UNI upside: Increased usage, new revenue streams, ecosystem growth & strong community support could benefit UNI holders.
The COINBASE:UNIUSD chart looks ripe for a sharp move up here, both in the short and long term...
I would consider long exposure, if not already in.
Best of luck!
Cheers,
Ivan Labrie.
UNIUSDT trade ideas

UNI USDT futureshey ... as i follow the downward movements ... and also below the good Average price !!!
so ..
gonna pull her short down :D

UNI/USDT (Uniswap, DeFi) Main trend. Pivot zones. UnlocksLogarithm. The main trend (all trading history). Time frame 1 week. The main trend to understand the main trend and cycles.
Long-term position work in the spot (you don't need to hold your coins on the exchange, so you reduce the risk). If you are not working locally, there is no point in holding coins on exchanges, which can appropriate your funds in case of "force majeure" circumstances under the general market situation. If you work long term, then you will sell some part of it after a few months (the probability is no more). Then buy back most of the profits and some of it already in the main distribution cycle, that is, in a few years (1.8-2.2 years, the peak of the market).
It is worth noting that in 2023 there is quite a lot of unlocking of coins on this cryptocurrency.
Shows the percentage of price growth from the main reversal zones from the key support/resistance levels in the case of retention or on the contrary breakout. The work with martingale in case of a negative scenario (averaging, predetermined amount of money).
This is what it looks like on a line chart (without market noise).
This non-logarithmic chart was published about a year ago at the beginning of the accumulation (sideways) channel formation.
UNI/USDT Main Trend. Time frame 3 days.
News background now: Uniswap Labs announced the launch of Uniswap v4


UNI/USDT Crucial area. Could Break this area or rejected ??💎 UNI has recently demonstrated notable market dynamics, currently encountering resistance in the supply and Bearish Order Block (OB) area.
💎 A breakout above this zone is necessary for sustained upward movement, probability leading to significant price appreciation and the attainment of our target area.
💎 However, if UNI fails to break out above the supply area, it may face rejection and retreat to the support zone around 5.61 to gather new bullish momentum.
💎 Upon reaching the support area, UNI needs to bounce back upwards to resume its upward trajectory and attempt to breach the supply zone once again.
💎 Should UNI break below the support level, it would signal a shift in market sentiment towards bearishness, potentially leading to further downward movement towards the demand area or even lower.

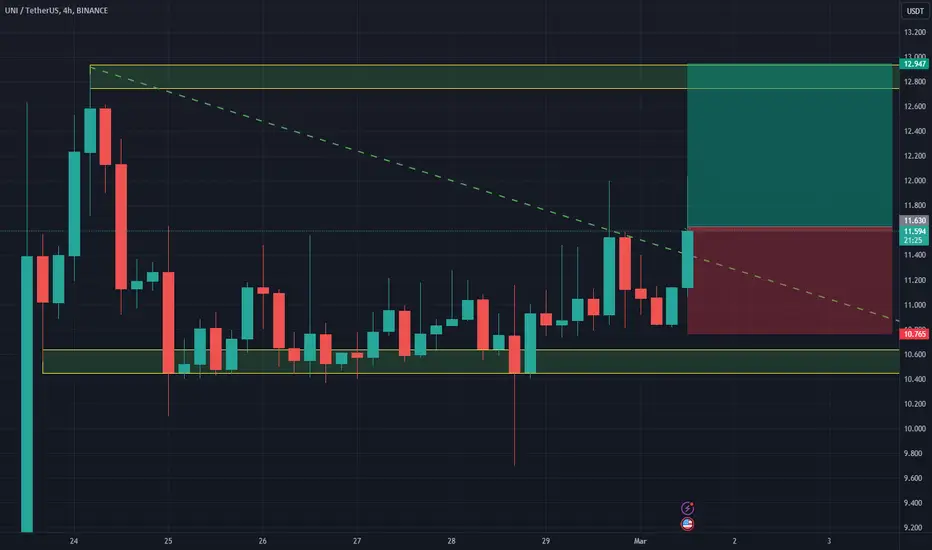
long UNIUNI broke through the descending trendline. The bullish trend is expected to continue and reach the resistance level at $12.94
UNI/USDT Break the key resistance area. Bullish Momentum ???💎 UNI has been a focal point in the cryptocurrency market, having recently achieved a significant breakthrough by surpassing a key resistance area and breaking out of a bullish pennant pattern.
💎 This advancement indicates a potential retesting phase at what was previously resistance, now serving as support. Successful retesting could pave the way for continued upward movement, with the next target being a strong resistance area.
💎 During this retesting phase, it's crucial for UNI to demonstrate a robust bounce off the support area to maintain its upward trajectory. Failure to hold this support level could result in UNI retreating to the demand area, specifically around the $6.1 mark.
💎 The $6.1 demand zone becomes a critical point for UNI. For the asset to resume its upward path, a strong rebound from this level is necessary, aiming to surpass and sustain above the former resistance level.
💎 This action is vital for continuing the upward movement towards the strong resistance. Conversely, if UNI fails to hold this demand level and breaks down, it could signal a shift towards a stronger support area.

UNI/USDT Bullish Surge from Key Demand Zone? 🚀UNISWAP💎 Paradisers, get ready for an exciting trading prospect with #UNIUSDT, as it shows promising signs of a bullish continuation from its demand zone.
💎 Exploring #UNISWAP trajectory, we've observed its ascent from a significant supply level at $7.727. After a brief deceleration, our focus shifts to a potential bullish leap from the demand level of $7.232, where an abundance of liquidity further bolsters the case for a reversal. Remaining steadfast at this point could set the stage for the bullish expedition we're envisioning.
💎 If momentum for #UNI starts to wane, our eyes are on a rejuvenating rebound from the firm demand level at $6.916. However, a descent below this pivotal level could signify the beginning of a more pronounced bearish trend.

UNIUSDT Trade Idea (4RR: +20% Pump??)This is not financial advice and you can risk serious money if you take this trade.
Check out my previous call on UNIUSDT, this trade idea is just an update from that.
- Retracement on Daily TF
- 1H MMBM
- 1H MSS
- 1H FVG
Rally Higher With Respect To HTF Trend.

UNI/USDT breakout after two year consolidation- UNI/USDT Accumulation for 658 days is over
- Strong breakout on increased volume to FIB 0.236 lvl
- Strong fundamentals, a lot of important updates these days
- CRYPTOCAP:UNI target zone is 24.16-29.13

UNI Round 2 Self Explanatory, whales been holding price down all week, (in Sean Connery voice) waiting, just waiting for the tides to be right.
Let's go!

UNI Possible Scenario UNI Bullish Scenario
Pullback from trendline
Waiting for breakout of residence line.
After retest of breakout will go long

UNIUSDT Elliott Wave CountLast Friday's move just made it more bullish.
The $13 mark would provide a huge resistance (look back to 2021).
The fifth wave of the (iii) wave is going there I believe.

Uni/USDT fifth wave UNI/USDT printed huge candle in single day +75% as third wave now in process completing forth wave (correction ) to complete full cycle of major first wave

SNX: SetUP Identity of the UNI pamp model with the model formed on SNX. I believe that it is possible to work out the setup in Long on SNX.

UNIUSDT Long; Second Pump To Pushing Above $13 EASY BIG GAINS!!!Looking for UNIUSDT to push above $13 into a monthly PD Array.

#UNI/USDT#UNI
The price has been moving in a downward channel since August 2022
The price is now on its way to a downward trend
The price now is 5.47 $
First goal 6.63 $
Second goal 7.73 $
Third goal 9.0 $
Which represents 210 % of the current price
With significant oversold and upward momentum
We also find that the MACD indicator is highly oversold
All of this supports the falling channel pattern, whose upper trend we are about to reach
We have a big support area on the chart at the price of 4.5 $

#UNI/USDT #UNI
We have a decline with the market falling. The price is expected to reach the support level of 5.23.
Where there is Moving Average 100 support
Then it bounces up to break the bear flag 8.78
With a target level of 8.87

UNI/USDT: UNI descending triangle, possible breakout ?UNI is currently trading inside the descending triangle and we can expect some movement inside the the triangle.
if the current momentum continues we can expect the upward moment and we will enter a long trade when price breaks upward.
if the price breaks the support then the trade invalid. price could settle in the next support at around 4.8
Entry Price: 6.222
Stoploss: 5.583
TP1: 6.571
TP2: 6.954
TP3: 7.685
TP4: 8.277
Don't forget to keep the stoploss. Like and follow us for more similar trade ideas.
Cheers!
GreenCrypto

asset selection look for 10%+ crypto gainers on scanneralmost every day we see 100%+ gains on crypto assets that can be traded with 10x - 100x leverage.
no financial advise but why not set an alert and whenever a crypto asset gains 10% invest at least something ?
this is not pump and dump but a clear opportunity for so many alt coins that have clear upside potential on the daily chart...

UniSwap- MFI EXTREMLY Oversold. Bulls Load Up. Market Cap 3.1 Billion
Up a nice 2,400% before the RSI Bear Div and the "Incredible Sell" prints.
Price has corrected 92% since and was gobbled up from the 0.786 fib level.
Big Volume Profile in this range with POC around $3.80
Weekly Heikin Ashi Money Flow Index sits at 0.11!
Stochastic Oversold.
Long Term Bulls should now DCA.
Could it drop further? Sure. I don't try timing tops or bottoms.
Speculative Setup, DYOR. Allow 3-18 Months For all Crypto Ideas.
Credit to @without_worries for allowing use of indicators.

UNI - FollowupCRYPTOCAP:UNI
A follow-through on the trendline pointed out before to the range mentioned before.
But most importantly, look at that sexy momentum volume

UNIUSDT Long IdeaUNIUSDT broke out of triangle on 3D.
I'm expecting a pullback and a continuation of the move upwards.
