UNIUSDTHello Traders,
As we can see tha chart pattern of UNIUSDT, It is moving in a channnel or range and following accurately after coming to support we can expect bullish move.
UNIUSDT trade ideas
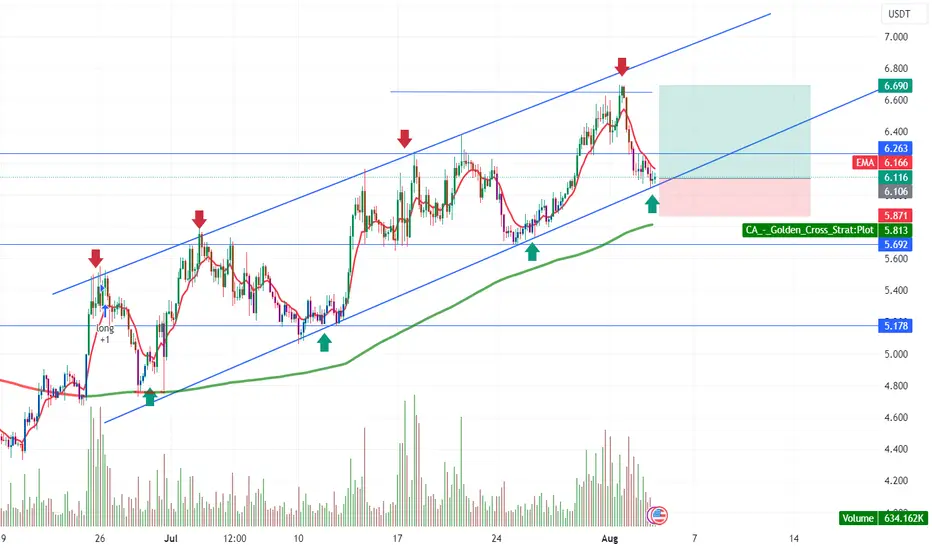
long UNIBME:UNI bounced off the ascending trendline. Bullish movement to resistance level at $6.64 is expected to happen.

UniUsdt trend reversal ?Uniswap making the channel pattern, a bearish flag breakdown of pattern can lead uniusdt to fall.
.
.
.
.DYOR

UNIUSDTUNIUSDT is in strong bearish phase. Potentially printing LH and LL.
There is no divergence so there is no sign of reversal from here.
We take trade at CMP.

bull time is enough! #UNIFriends,
I keep it simple;
RSI is over 70,price is in a resistance area and thats enough for me to sell.
The market is beautiful. We're working.

Finally Breakout above the Descending Trend Line | New CycleWeekly Chart
UniSwap BINANCE:UNIUSDT was under the descending trend line, you can see that on Weekly Chart
Daily Chart
Last week, Uniswap has broken out resistance and now it's trading at 6.42x
Uniswap has support zones around 6.1
Wait a retest and join Defi's trend

Uniswap UNI price price is accelerating, how long will it last?It seems that in early June, the UNIUSDT price did manage to break out of the prolonged downward trend.
Well, we're keeping our fingers crossed that buyers will be able to accelerate the growth even more. Buyers have a "difficult path" ahead of them, as there are strong liquid zones above, where there will be many people willing to sell their UNI, which is lying around in their crypto portfolio and weighing it down with its price drop.
The first critical level from above is $7.50. This is where the first "serious struggle" between buyers and sellers will begin. The outcome of the battle will determine which route the UNIUSD price will take next - white or blue.
One way or another, the medium-term target, where we believe the price of the Uniswap token will sooner or later reach, is in the range of $12.25-13
_____________________
Did you like our analysis? Leave a comment, like, and follow to get more

good sellthe price complete the [ullback to the break even in the edge and also we have 2top
we can get a short position in market price now
are youu agree?


UNIUSDT is at its support levelHello everyone! Let's return to the review of ordinary coins. UNIUSDT has a pretty good and readable graph. There was recently an idea for this coin, where we achieved all the goals. Therefore, now there will be an addition to the idea. The coin still follows its support - an inclined line. The price does not update the minimums, it goes up the ladder. At the moment, the coin is on its support - 5.7. From this value, the coin should walk to its next resistance at 6.4.

UNIUSD ❕ under the rangeRSI is moving in a bearish zone and has formed a bearish divergence on the 4H TF.
Price has broken down through the 50EMA on the 4H TF.
The 50EMA has broken down through the 200EMA on the 1H TF.
I expect a decline after fixing under the range.

UNI/USDT 4H LONG SCALPThe breakdown of the structure in the 4-hour time frame is quite clear, and the price has strongly fallen to the EMA20, the price can first retreat or correct to the 6.137 level, and then we will continue the downward trend, the first target [/il can be the 5.67 point.

short UNIBME:UNI broke through the ascending trendline. Decline to support level at $5.69 is expected to happen.

a good chart for sellthe price is recive to a weakly suply with the wedge pattern and we have RD in RSI we can get a short position
do you agree with me?
write for me

UNI target 9.8~10.61D time frame
-
UNI broke the falling wedge structure.
Retesting is good to take entry and set trading plan.
TP: 9.8~10.6
SL: 4.515

BUY UNIUNI appears to be a promising buy at the moment. If you decide to invest, consider holding it for potential long-term gains.

UNIUSDT Bearish Divergence 1H and 4H🚨📉 Alert to Crypto Traders 📉🚨
📈 #UNIUSDT #BullishTrend #BearishDivergence 📉
Crypto community, pay attention to UNIUSDT! 🚀📉
📈 The overall trend for UNIUSDT in the 1-hour and 4-hour time frames remains BULLISH, forming Higher Highs (HH) and Higher Lows (HL). 📈📈📈
🚨 However, we've spotted a concerning sign: #BearishDivergence on the Momentum Indicator RSI. 📉 RSI is showing Lower Highs (LH) and Lower Lows (LL) despite the price making higher moves. 📉📉
📉 This bearish divergence can be an early warning signal of a potential trend reversal or correction. 🛑🔄
📝 Trade Recommendation:
📌 Keep a close eye on UNIUSDT's price action and RSI movements.
📌 Consider tightening stop-loss levels or reducing position sizes to manage risk effectively.
📌 Exercise caution when opening new long positions, as the bearish divergence could lead to a pullback.
📊 Remember, successful trading involves understanding both bullish and bearish signals to make informed decisions. 🧠💡
🛡️ Trade responsibly and stay updated with market trends! 🚀📉
#CryptoTrading #TechnicalAnalysis #RSIDivergence #TradeSmart #RiskManagement #MarketAnalysis
Disclaimer: This analysis is for informational purposes only and not financial advice. Cryptocurrency trading carries risks, and past performance does not guarantee future results. Always do your research and consult with a professional financial advisor before making trading decisions.

UNIUSDT-IN BULLISH TRENDUNIUSDT in 1 hour time frame is in bullish trend and makina a series of higher highs and higher lows. We also confirm from rsi that its making HHs and HLs which indicates the continution of bullish trend.

UNIUSDT: Potential Trend Reversal Amidst Breakout and Bounce.💎Recently, #UNIUSDT successfully broke out of the descending channel and surpassed the supply zone, confirming a shift in market dynamics. Subsequently, the price underwent a correction and achieved a clean bounce off the 61.8% Fibonacci support level, indicating a potential shift in the trend from bearish to bullish.
💎Currently, #UNI is positioned within the demand zone, which serves as a crucial starting point for the next upward swing and potentially significant price increase. To assess the potential upside, we turn to the Volume Profile and Fibonacci indicators, which highlight three key resistance levels to monitor. The nearest resistance lies approximately 20% above the demand level, while the final resistance is situated around 35% higher.
💎However, the realization of these gains hinges on the avoidance of a new lower low, specifically, a daily close below the critical support level at $4.74. It is important to note that the market may enter a consolidation phase, characterized by range-trading, lasting for another week or longer. While the probability favors an eventual upside move, Paradise Club Members must remain patient.

UNIUSDTUNIUSDT is in strong bullish trend and currently trading in bullish parallel channel. Currently the price is retracing to nearest level but seems like the instrument is getting ready for another bullish move.
what you guys think of it ?

Uni Buy SetupMy Study On Uni.
Welcome to my channel! Here you'll find daily technical analysis ofthe latest trends in the crypto market. From Bitcoin to altcoins, I'lIl be sharing my insights and predictions to help you make informed decisions
about your investments. Follow me for the latest updates and join the conversation in the comments!
Crypto technical analysis uses past price history to predict future price. It's not a guarantee and shouldn't be relied on solely for investment decisions. Consider other factors such as market trends, economic strength and
information dissemination. Use with caution.
This Is Not A Finacial Advise

Brief Analysis ——UNIAt 10:00am Jul.17 local time, ETHCC, the largest annual Ethereum community conference in Europe, was held in Paris. The conference will last for four days. Some classic protocols will bring new mechanisms, new plans and new routes. Today we will share 3 project tokens participating in ETHCC, UNI, 1INCH and CRV. Prepare for the possible pump.
As early as the beginning of July, UNI had already repaired the FUD of SEC. Price continue to rise with callback. From a larger scale, UNI has remained fluctuating within a range (gray area) since November last year. Although UNI broke through the range in June, it came back soon. Compared with 2022, the volatility of UNI has dropped a lot. In the rising process this time, UNI performed better than most tokens, but as the emission token of Uniswap, even in the process of rising, the bears is still obvious (red arrow). Uni keep neutral on a large scale.
Conclusion: The high probability rise has not ended. Bulls is stronger than bears now, so we draw this conclusion. However, short-term rise and long-term fall is relatively rare. Bears is not weak. This is a more difficult variety to trade at the daily level. We set resistance level at 6.5 and support level at 5.
If you have any ideas, welcome to communicate with us:)
Disclaimer: Nothing in the script constitutes investment advice. The script objectively expounded the market situation and should not be construed as an offer to sell or an invitation to buy any cryptocurrencies.
Any decisions made based on the information contained in the script are your sole responsibility. Any investments made or to be made shall be with your independent analyses based on your financial situation and objectives.

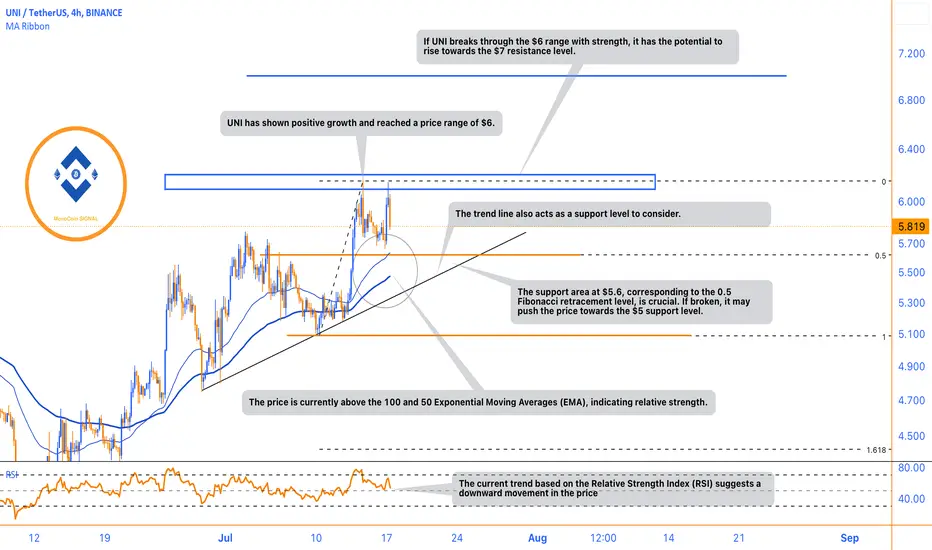
UNI Price Trends and Potential Support/Resistance LevelsUNI has experienced significant growth and its price has reached the $6 range. However, based on the Relative Strength Index (RSI), there is currently a downward trend in the price. It is worth noting that the price is still above the 100 and 50 Exponential Moving Averages (EMA), indicating a relatively strong position.
If UNI manages to surpass the $6 range with strong momentum, it has the potential to climb towards the $7 resistance level. On the other hand, the support area around $5.6, which coincides with the 0.5 Fibonacci retracement level, holds crucial importance. If this support level is breached, it could lead to a decline towards the $5 support level. Additionally, it is worth considering the trend line as another potential support level.