UNI S&R IN SHORT TERM>>>>>>
Hello EveryOne
I Have Tried My Best to Bring the best Possible outcome in this Chart.
short term support & resistance's marked on the chart.
>>>>>SPOT TRADE.<<<<<<<
It's just an analyze,
Not a financial advise.
PLZ DYOR
With hopping success>>>>>>>>>
UNIUSDT trade ideas

UNI has strong chance to jump soonas you see on daily chart, UNI coin is moving sideways for a while however things may change in days coming.
right now price is moving above the 200 MA on daily chart. and MACD on 3D timeframe is positive but
still has low strength for strong move.
also we can see price closed above the trend line and the baseline on the chart too.
so if the price can hold the blue area we can expect an impulsive rally upward in days coming.
I also can see same opportunities on some other coins and if it is we may see a good possibility of ALT season soon.
main support and resistant levels (assuming targets) are on the chart.

UNI - BULLISHnot triggered within 15 hours o 23 14:55
Uniswap (UNI/USD) Price
Frequency Remains Around $7
It is currently observed the UNI/ USD market transactions have been witnessing some uprisings in their valuation over time above the $6 line as the crypto-economic price frequency remains around the $7 trading level to decide which path to follow afterward between $7.0196605 and $6.8076484.
The percentage rate of the trading pace is at 1.50 negatives.


UNIUSDT Elliott Waves AnalysisHello friends.
Please support my work by clicking the LIKE button👍(If you liked). Also i will appreciate for ur activity. Thank you!
Everything on the chart.(update)
Nothing has changed from my last idea,everything is relevant.
Targets: 7.5 - 10 - 12
Main Target zone: 12 - 15$
after first target reached move ur stop to breakeven
Stop: agreesive 4.8, conservative 3.4 (depending of ur risk). ALWAYS follow ur RM .
Risk/Reward: 1 to 10
risk is justified
Good luck everyone!
Follow me on TRADINGView, if you don't want to miss my next analysis or signals.
It's not financial advice.
Dont Forget, always make your own research before to trade my ideas!
Open to any questions and suggestions.

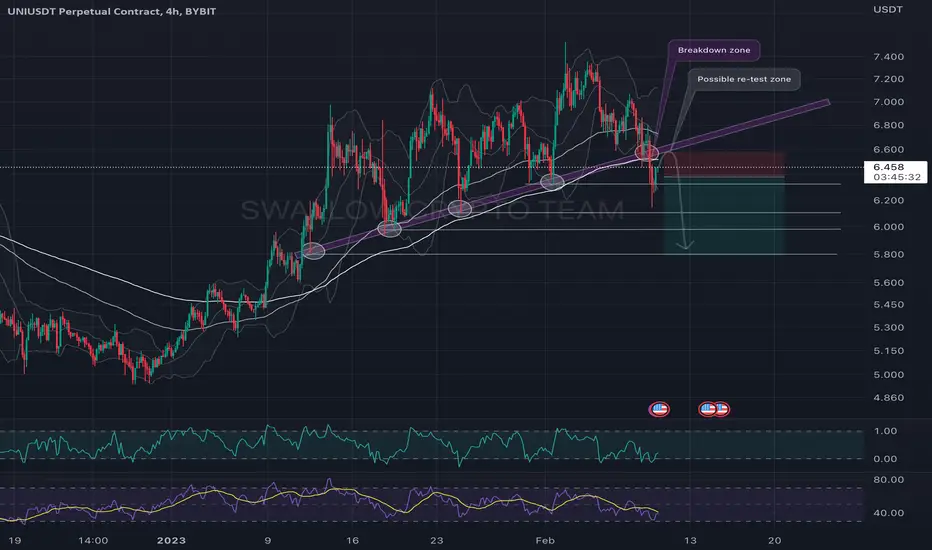
UNI/USDT possible re-test to happenHey, guys ✌️
Let's kick this day off with UNI coin here. We see that we had a nice breakout from that triangle formation but price is finding it hard to break the 200EMA line. There is a good chance for a re-test of the upper of the triangle formation which might as well result a breakdown from there.
If you like ideas provided by our team you can show us your support by liking and commenting.
Yours Sincerely,
Swallow Team 🔱
Disclamer:
We are not financial advisors. The content that we share on this website are for educational purposes and are our own personal opinions.

UNI USD LONGWave counting based on Elliott waves
and analysis based on classical channels and patterns

UNISWAP Weekly View - February 2023Hello Guys, Weekly Analysis is on the UNIUSDT Symbol in a 4H Time frame, I Hope it Will be Useful for You, Don't Forget to Like, Follow, Comment


UNI/USDT might go for re-testHey, guys ✌️
Next one on our watchlist is going to be UNI/USDT pair. A strong trend has been broken which left behind 100 and 200EMA zones. We see a good chance for this coin we are going for lower levels so let's see what we will end up with here!
P.S we need to wait for entry to be confirmed before entering here!
If you like ideas provided by our team you can show us your support by liking and commenting.
Yours Sincerely,
Swallow Team 🔱
Disclamer:
We are not financial advisors. The content that we share on this website are for educational purposes and are our own personal opinions.
Trading Idea 034: UniswapMarket Conditions:
- bullish trend
- bullish sentiment in the market
Key Level and Lines:
- $7.00 support
Trading Ideas:
- go long after consolidation above the support
- go short if the price moves below the support and there is bearish sentiment in the market.

UniusdtLooks very similar to dydx accumulation zone pre breakout
Largest volume dex by far the 1st and still the best

UNISWAP Weekly View - February 2023Hello Guys, Weekly Analysis is on the UNIUSDT Symbol in a 4H Time frame, I Hope it Will be Useful for You, Don't Forget to Like, Follow, Comment

UNIUSDT PRICE MOVEMENTUNIUSDT is going to premium area for midterm timeframe
preparation for limit short sell in 7.666
stoploss in 7.871
Take profit in 7.220 - 7.112 - 6.500
Get 500 USDT competition trial balance and trade then win the total prize $1000 by taking part in Deepcoin Free Battle Event.
Show your trading skill in Deepcoin free competition, win the prize, dan get the another bonus! Get in on Google play, Appstore, and link in profile!

UNIswap ideasome levels for uniswap since i dont think ive charted it before if not in a while. potential is there wlel see what the litigation says at the end of the day defi revolves around the language of the laws, could see it being throttled by the government

Could UNI Moon PleaseMooN PLEASE Uni SPAW you have a GOOD fundamental PLEASE MOON, I don't HOW TO COUNT ELLIOTT WAVE I DON'T KNOW ABOUT THIS SO, doNot Believe me


#Uniswap in a Rising Wedge, Support At Dec 2022 Highs at $6.5Past Performance of Uniswap
Uniswap prices may be wavy, moving in a mix of up and down bears, but the uptrend is clear. Buyers are in control, trading above December 2022 highs of around $6.5. In the days ahead, traders should track how prices react at support, the $6.5, and the middle BB, the 20-day moving average. Sharp gains above yesterday's highs at $7.5 will see UNI climb above November 2022 highs, reversing losses.
#Uniswap Technical Analysis
The path of least resistance is northwards for UNI. Though prices are wavy with bear and bullish bars in the mix, it is until the coin breaks above $7.5 that conservative traders can accumulate. For now, prices are inside a rising wedge, supporting optimistic bulls. Aggressive traders can buy the dips as long as the coin trades above $6.5, targeting $7.5, and later $9.5, if buyers step up in a bullish continuation formation. If not, losses below $6.5 may see the token drop to $6 and $5.5 in an inevitable correction.
What To Expect From #UNI?
Buyers could be firm, but the uptrend will be more solid should a convincing, high volume close above the rising wedge. In that case, UNI may rally to $9.5 as buyers double down.
Resistance level to watch out for: $7.5
Support level to watch out for: $6.5
Disclaimer: Opinions expressed are not investment advice. Do your research.

UNIUSDT Good Buy!UNIUSDT Technical analysis update
Buy zone: Below $7.05
Stop loss: $6.20
Take Profit 1 : $7.70
Take Profit 2 : $8.70
Take Profit 3 : $10.25
Take Profit 4 :$12.00
Always keep stop loss

UNIUSDT consolidation is onUNIUSDT is at the top of the range, which should start inviting short-term sellers. A 10% drop can easily take place unless a new HH is produced.

Uniswap In tight range Formed Symmetrical Triangle In Daily Timeframe
Incase Of Breakout Expecting Move Towards (13 -14 Area )

UNIIdea: Price has formed a triple top or head and shoulders pattern. The uptrend line has been broken. POC level - nearest strong support level.
The price is in the oversold zone on the hourly chart

UNIUSD ❕ ascending channelUNI is trading near the liquidity level.
TD Sequential has formed a reversal signal upwards (1H TF)
A reversal is possible soon.
