UNIUSDT trade ideas

UNIIdea: The price failed to gain a foothold above the 200 EMA. the POC level has become a strong support. A breakdown of the POC level will lower the price to the specified support area. Bullish scenario indicated. It is also possible to form a head and shoulders pattern.

UNI another leg upUniswap is breaking out and looking for a safe trade here.
RISK-REWARD
The Risk to Reward ratio on this trade is 7.2 so it is quite high, we recommend to close 75% of the position at the $7.7 area.
POSITION SIZING
We would not recommend anytime to open position more than 2-5% of your balance, but in this trade we are currently opening a 5% trade
I am so grateful for the support and engagement of my readers. Thank you for taking the time to read my analysis and for providing valuable feedback and insights. Your support means a lot to me and it's an honor to be able to share my knowledge and experience with you. I am constantly inspired by the community on TradingView and I look forward to continuing to learn and grow together. Thank you again for your support and for making this journey so enjoyable!

Rise, then fall.. Pay attentionIt is expected to rise to the specified area, from which it will begin to drain to a new, final and final bottom.

long per modelbought some here. I could see this hitting 7.4240 by a few days. Its a possible run situation

UNI ready to explode?Hello everyone, today we have #UNI Coin Analysis
It got on our Watch List back in June during the rebound of the market, as it grew stronger than the market. After that, UNI held up just as well during the #FTX scam.
We were able to hold the $5 level and now we are above all the moving averages
#Bitcoin and the entire market in general are looking very strong right now, but we would first expect a good growth in Ethereum and then UNI
Potential Targets $7.5 and $9.5

Uni Swap Break Out!UniSwap has broken its downtrend and exited its triangle pattern.
There is a higher probability of climbing.

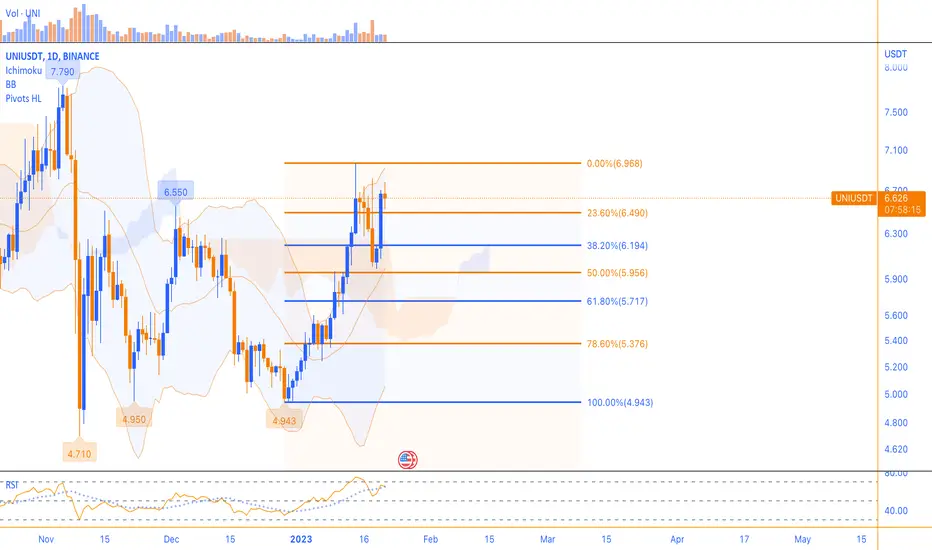
The possibility of continuing the range trendAs long as the support level of $6.19 is maintained, the potential for a reversal in the daily timeframe will again be provided. The 4-hour time trend will not be bearish as long as this support is held. Due to the high strength of both ranges, the probability of the range trend continuing this week is high. If the strong candle closes above resistance without an upper shadow, the next target will be at $7.5 - $8 area.
UNI viewNFA, DYOR.
This is UNIUSDT on 4H timeframe.
We had an impulsive wave down on PPI data release, that broke the support ascending trendline.
Now we are forming a bearish flag under it, and if it breaks down, as expected, it could quickly go to a measured level down; red box below.
We already took the range high, so lower levels are expected for now.
Stay safe.

UNI Breakdown!KUCOIN:UNIUSDT
Since posting a few days ago, UNI ran +25% and started to print a flag that developed into a descending triangle.
After the "liquidity run" (see 1-hour) I entered on 5m in the yellow dotted zone for a quick short and ~9%.
PLAN NOW:
1. Bearish Retest of Triangle could provide a further SHORT opportunity to the white pullback zone as a possible target.
2. If the price breaks back into the Descending Triangle look to LONG trapped bears.
This market is dynamic and with patience you can execute laser moves.
As usual Bitcoin rules the direction.
If you liked this idea or if you have your own opinion about it, write in the comments.
The information and publications are not meant to be, and do not constitute, financial, investment, trading, or other types of advice or recommendations.

XMR/USD - Monero: Bearish FlagThere is a symmetrical triangle developing, the price breaks out soon. A symmetrical triangle can be thought of as a specific chart indicator that typically signals a move down once price breaks through the support. There is a probability of a rangebound towards the 6.2 zone on a breach of 6.3.

UNIUSDTDisclaimer
High Risk Investment
Trading cryptocurrencies and Forex carries a high level of risk, and may not be suitable for all investors. Before deciding to trade cryptocurrency you should carefully consider your investment objectives, level of experience, and risk appetite. The possibility exists that you could sustain a loss of some or all of your initial investment and therefore you should not invest money that you cannot afford to lose. You should be aware of all the risks associated with cryptocurrency and Forex trading, and seek advice from an independent financial advisor. Since Any opinions, news, research, analyses, prices, or other information contained on this website is provided as general market commentary, and does not constitute investment advice. The Bibres will not accept liability for any loss or damage, including without limitation to, any loss of profit, which may arise directly or indirectly from use of or reliance on such information. All opinions expressed are owned by the respective writer and should never be considered as advice in any form.
A qualified professional should be consulted before making any financial decisions.
-------------------------------------------------------------------------------------------------------------------

The Setup Is Extremely Bullish👉 Clear Bull Flag Formed At The Chart And I Expect a Heavy Pump In Near Future ,Bought a Bags Of UNI Here At 6.6$ Area ,Targets Are 7.7$ ,9.8$ And 13$

UNI (Uniswap) long, retest of daily breakMarket waiting for a pull back, but when? I think that buy the retest of the daily trend break (with a tight stop loss) could turn out to be a big trade. There's quite a risk that this trade can be stopped out, but the upside looking good. I see daily breaks now as possibly entries for long time hold.

UniusdtTesting Trendline In daily Timeframe Incase Of breakout Expecting 120 to 150% Bounce
Entry Will Be Valid After Confirmed Breakout Sl area Would Swing Low


UNI/USDT 1DAY UPDATE BY CRYPTO SANDERS !!Hello, welcome to this UNI/USDT 1DAY chart update by CRYPTOSANDERS.
I have tried to bring the best possible outcome to this chart.
Show some support, hit the like button, and follow and comment in the comment section. this motivates me to bring this kind of chart analysis on a regular basis.
CHART ANALYSIS:-Uniswap (UNI) was another notable gainer on Friday, as prices rose for a fourth straight day.
UNI/USD raced to a peak of $6.02 earlier in the day, which comes less than 24 hours after falling to a bottom of $5.73.
This move sees the uni swap edge closer to a recent high of $6.40, which was last hit on Nov. 16.
As a result of these recent gains, UNI is now almost 11% higher in the last seven days, with the RSI tracking near a one-month peak.
The index is currently at 53.25, which is its strongest point since Nov. 6, and this comes as the moving averages of 10-days (red) and 25-days (blue) look set for an upwards crossover.
Should this occur, we will likely see UNI bulls target a resistance level of $6.50.
This is not a piece of financial advice.
Hit the like button if you like it and share your charts in the comments section.
Thank you

UNI Cup & Handle!KUCOIN:UNIUSDT
UNI is printing an aggressive pattern. Once it engages with a successful retest of the 5.55 zone possible upside to 6.2 resulting in a larger cup for re-entry possibilities. Today SPX Futures open as well as BTC Futures which are at resistance. Possibility to enter at a more favourable level.
If you liked this idea or if you have your own opinion about it, write in the comments.
The information and publications are not meant to be, and do not constitute, financial, investment, trading, or other types of advice or recommendations.


uniuni technical analysis basically on elliott waves Principles and Priceaction strategy
Uni can be touch 23$
Wait and watch.

Uniswap / My view of the currency in the long term I expect that these areas will form a bottom
Add to watchlist
If you want deals with targets and stop loss
Connect with us

UNI Local Long Target $6Market finding some localised support as BTC works towards $17,200.
UNI target is $6, posily higher if it can stay above this 4hr 200 MA.
LTC, Atom should sit around their current price and consolirate while the rest of the market moves up - opportunity to take profits and switch into these in week or so.
Best, HF
