UNIUSD ❕ bearish divergencePrice formed a bearish divergence with RSI and trading volumes (4H TF)
TD Sequential formed a downward reversal signal (4H TF)
I expect that the asset may start a correction when it consolidates in the liquidity zone.
UNIUSDT trade ideas

Oportunity or not?Looking at chart like this we can see bullish flag on UNI/USDT, but I don't think this is gonna be a BIG pump.

UNIUSDT wants the breakout? Need the Volume!The price is testing the daily resistance as new support at 6.5$ area.
The market needs to create a new breakout and flip the supply zone into new support
How to approach it?
IF the price is going to have a breakout from the descending channel and retest the resistance as new support, According to Plancton's strategy , we can set a nice order
–––––
Keep in mind.
🟣 Purple structure -> Monthly structure.
🔴 Red structure -> Weekly structure.
🔵 Blue structure -> Daily structure.
🟡 Yellow structure -> 4h structure.
⚫️ black structure -> <= 1h structure.
–––––
Follow the Shrimp 🦐

UNI - AnalysisLast week, UNI stopped its uptrend at the $6.50 resistance area, and given that this resistance area was broken down in the past with strength and is considered a reversal zone in the 4-hour time frame, it can still Be accompanied by a negative reaction. For this purpose, you can consider a downward trend line on the last waves in the 4-hour time frame. If the downward trend line is broken due to the negative divergences of the RSI indicator in the 4-hour timeframe, we can expect to see the price drop again towards the support of $5.
But if the efforts of the buyers can bring the price back above the resistance of $6.60, we can expect the price to grow to the resistance range of $7.45 to $7.88. But we expect a stronger reaction in this range. The trend is still bearish on the daily time frame, and there is a possibility of a retest of previous support levels. The RSI indicator shows a hidden positive divergence in the daily time frame, but there is no definite sign of trend reversal yet. Therefore, the support of the rising trend line can be very helpful this week.

UNIThe price has formed a symmetrical triangle and is sandwiched between the 50-200 EMAs and the daily 50-100 MAs. A break of the daily MAs would be a strong bullish signal. The RSI has broken the uptrend line, which may indicate a bearish scenario.

UNIUSDT 1W LONG ANALYSIS Hi, friends. Nice to meet you
UNIUSDT A WEEK CANDLE IS ON SUPPORT LINE.
It will continue to be supported, and if it succeeds in retesting by surpassing 8.806, it is expected to show a stable rise.

UNIUSDT 1D Interval- Targets and StoplossHello everyone, let's take a look at the 1D UNI to USDT chart as you can see the price is moving above the local uptrend line.
Let's start by setting goals for the near future that we can consider:
T1 - $ 6.65
T2 - $ 6.88
T3 - $ 7.08
T4 - $ 7.28
and
T5 - $ 7.56
Now let's move on to the stop loss in case of further market declines:
SL1 - $ 6.35
SL2 - $ 6.08
SL3 - $ 5.86
SL4 - $ 5.64
and
SL5 - $ 5.33
Looking at the CHOP indicator, we can see that in the 1D range we have recovered a lot of energy and the MACD indicator shows a local upward trend.

UNIUSDT LongSince the price formed the lowest low @5.25, it has been on a bullish momentum until it formed the highest high, and the price has been forming a bullish pennant, which might be a strong indicator of a potential bullish momentum.
I am waiting for the price to break out of the pennant, and retest the zone I have highlighted so that I can enter my position.
The entry position is @6.52, Stop loss @6.1, just below the support zone. Tp 1 @6.94, Tp 2 @7.37, Tp3 @7.79
My R: R is 1:3.
Remember to risk 1-2 % of the account.

Uni usdt long Going long on uniswap token is the best idea right now
Reason?
On demand zone( tested both major and local demand zones)
Target is more than 90% on spot
Enjoy your weekend!!

UNI - not bullish let me rephrase - It looks okay for short term, but I wouldn't be expecting it to break up - unless whole crypto bounces up. Taking into account nowadays situation - I'd expect a retouch of the top of the trendline and a fall to lower support. UNI has been pumped since the beginning which suggests to me that it was artificially pumped to get liquidity into this asset. More downside to me.

#Uniswap Adds 20%, UNI Resistance at $6.8Past Performance of Uniswap
Uniswap is up 20 percent from September 2022 lows, per the formation in the daily chart. Despite the shake-off of September 29, the uptrend in the short term remains valid, and $5.2 is a clear support level. In the past trading week, the token is up 10 percent, outperforming the USDT and the stagnating BTC.
#Uniswap Technical Analysis
The uptrend is valid, as mentioned earlier. Still, conservative traders can wait for a break above $6.8 before loading on dips in a bear continuation formation. If buyers have the edge and UNI soars to new weekly highs, the token could rally to $9.5, allowing traders to hitch the ride up. That will also confirm the significance of $5.2, a reaction line coinciding with the 61.8 percent Fibonacci retracement level of the June to August 2022 trade range. There will be a reason to worry if UNI slumps from spot rates below $5.8 since this could see bears of September 13 flow back, heaping more pressure on the token.
What to Expect from #UNI?
Uniswap, like most DeFi tokens, has been decimated by bears over the last ten months. Currently, UNI is at a minor liquidation level. However, if there are gains above this M-formation, UNI will likely rally and retest August 2022 highs. Contrary to this outlook, the token will snap bearish if bears press on, diffusing the current upside momentum.
Resistance level to watch out for: $6.8
Support level to watch out for: $5.8
Disclaimer: Opinions expressed are not investment advice. Do your research.

$UNI - Catching Up with $QNTHello my Fellow TraderZ,
This is very interesting to see how the #DEFI with strong fundamentals are showing the sign of reversal to the upside Breakout.
Here we have $UNI/Usdt chart exactly the replica of $QNT which recently broke its Inverse Head and Shoulder Pattern and currently retesting to confirm the Breakout.
$UNI is also about to complete the Right shoulder of the Inverse H&S. If this pattern plays out, will see a handsome profit of ~82% with upside movement. All eyes on #Btc which could anticipate this breakout.
Till then Happy Trading. CHEERS!!!

UNI short closed @ 6.1 for +25%My limit order was filed. We are now experiencing a pullback in price action. Expect a retest up today.


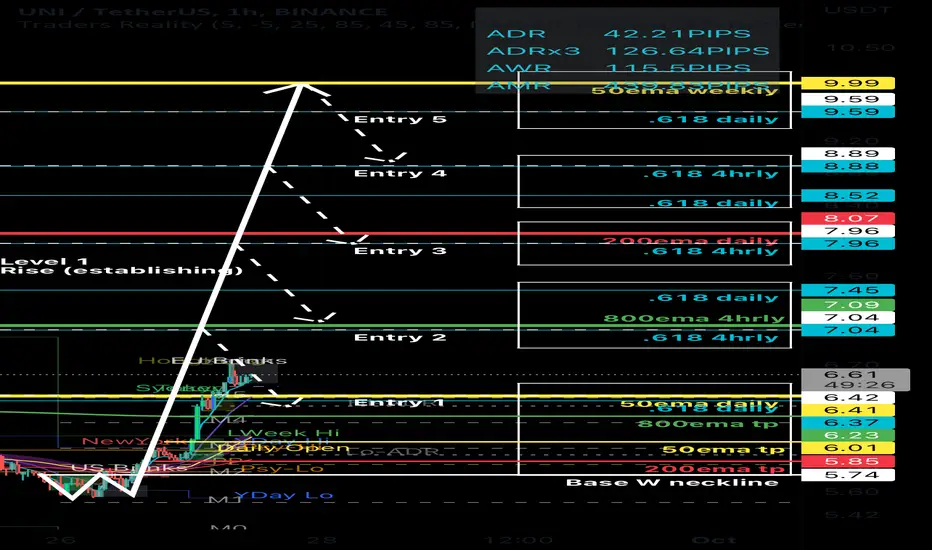
UNI - Potential SHORT -15MIN/1HR - Binance for BINANCE:UNIUSDTPETrading view post:
Trade Status: ACTIVE
Trader: Drizzzled (AUS)
Trade Type: SHORT
(RE-ENTRY/DCA ABOVE previous entry post)
Entry 1: 6.42 (entry 1 box options)
-if missed focus on next entries. Don’t stress.
Entry 2: 7.04 “”
Entry 3: 7.95 “”
Entry 4: 8.88 “”
Entry 5: 9.60 “”
Entry 6:
Entry 7:
Stop Loss:
Entry 1: Gann stop loss - 6.64 (entry 1 only)
-5-10% move from your chosen entry 1
-slightly above entry/key resistance
-1:1 or to own personal risk factor
Entry 2: “”
Entry 3: “”
Take Profit Targets:
-6.23 (800ema)
-6.01 (50ema tp)
-5.85 (200ema tp)
-
-
Comments:
-move stop loss to break even once target 1 is hit. DCA entries above/below if stop loss is hit.
-emas will rise/drop with time so shift tp accordingly. If we re-enter higher/lower our same emas become our take profits. Also i have put boxes around key supports which I may choose to take earlier or later profits at too.
-by all means you can long from the daily open to these higher target ‘short’ entries.
-you don’t have to enter at ‘entry 1’ if you would rather enter higher.
-level 1,2 or 3 ,pumps/moves, can go higher and create new levels, hence the re-entries. It’s a shorter time frame strategy.
UNIUSDT(Uniswap) Daily tf Range Updated till 27-09-22UNIUSDT(Uniswap) Daily timeframe range. one of the sad part of this alt is even tho it got actual utility and devs support, it still had a very long bleeding. good part is its still got retail interest and volume which makes it less unstable more tradable. there are lots of options for a daytrader in this chart and we can see the activity too on its many smaller range moves.

UNI Short @ 6.25 10x leverageMomentum upward is interacting with the 200-day EMA on a 4-hour chart. We've seen clear reversals happen from these points in the past.
We're far overextended in RSI.
Our MACD and TSI are starting to cap out as well.
VPVR is showing we're at one of the main volume ranges. I believe we'll see a pullback soon and I may add onto this position.

#UNI long if stays above $6`#uni as long as stay above $6 we are looking following targets, 6.40/6.50 , 7.25 and then $8.

Falling Wedge Continuation Chart Pattern DefinationThe falling wedge pattern is characterized by a chart pattern which forms when the market makes lower lows and lower highs with a contracting range. When this pattern is found in a downward trend, it is considered a reversal pattern, as the contraction of the range indicates the downtrend is losing steam. When this pattern is found in an uptrend, it is considered a bullish pattern, as the market range becomes narrower into the correction, indicating that the downward trend is losing strength and the resumption of the uptrend is in the making.
In a falling wedge, both boundary lines slant down from left to right. The upper descends at a steeper angle than the lower line. Volume keeps on diminishing and trading activity slows down due to narrowing prices. There comes the breaking point, and trading activity after the breakout differs. Once prices move out of the specific boundary lines of a falling wedge, they are more likely to move sideways and saucer-out before they resume the basic trend.

UNI 4h 22-sepPrice in a downtrend. Because FED decision to increase interest rate 75 points I consider the dollar will strengthen making all USD denominated to go down.
Entering short position:
- Price at 0.786 Fib retracement level
- Price at a high volumen zone (VRVP)
- ADX shows no strength on upward movement
- Entry pont at 5.8
- SL 1 ATR of entry point at 5.95
- TP from previous lows at 3.65 and high volumen zone (It might get only to support zone at 4-4.3)

UNI/USDT Bounce from global trendline 🏀Uniswap has broken the global ascending trendline and the price came back to retest it and it seems to be finding resistance. We have the additional descending trendline that could act as resistance plus the golden pocket of the Fibonacci. The current trend is bearish and I am looking for continuation with this trade. It is a high probability set up and price could look to test lower support levels.
Comment below your thoughts and questions! Give us a boost and share with your friends if you find our analysis useful, that would be of great support!

Double BottomDouble Bottom has broken through the resistance line on Sep 12, 12:00 UTC. Possible bullish price movement forecast for the next 4 days towards 7.3035.

Uniswap UNI trying to develop a growth trendYesterday, when the Bitcoin price was thinking go to new bottom or not, the UNI price stopped at +35% above the June 2022 minimum.
At the same time, yesterday's decline in the Uniswap token price stopped in a strong liquid zone.
In parallel, "a bullish wedge" pattern is formed, which often acts as a continuation of the growth trend.
Safe long after breaking the wedge up, above $6.20
The first goal for growth is in the area of 9 dollars
The global target for growth is in the range of $12.5-13
_____________________
Did you like our analysis? Leave a comment, like, and follow to get more
