TradeCityPro | UNIUSDT Delay in Crypto Bullrun👋 Welcome to TradeCityPro Channel!
Let’s analyze today’s altcoin during these days when most people are focused on red candles and feeling FOMO, inviting you to stay calm.
I have a feeling that these corrections and the previously released interest rates have caused the bull run we have in mind to be slightly delayed, but this event has also increased its
probability.
🌐 Overview Bitcoin
As always, before starting today’s altcoin analysis, we’ll take a look at Bitcoin in the 1-hour timeframe. We’ve reached the 91830 support level and had a good reaction to it, which further highlights its importance.
However, after this reaction, we formed a lower high and got rejected, moving towards this level again. If you pay attention, exchange orders have significantly decreased, and we can say that no one is making any specific trades, with most people waiting.
If the 91830 support is broken, we can move toward 86,000 USD , In case of breaking this support and Bitcoin moving downwards, if its dominance is also dropping, it’s a good idea to open a short position on Bitcoin.
On the other hand, if Bitcoin dominance is breaking through the 58.11% resistance, altcoins will face sharper declines.
📊 Weekly Timeframe
In the weekly timeframe, UNI has a relatively better position compared to other altcoins and has shown good upward movements, which is not unrelated to its excellent DEX platform.
The weekly candle for this week will close in 3 days. However, what has happened is that last week’s candle has been engulfed, and a lower high has formed, which could indicate temporary profit-taking.
For another entry, this 14.844 resistance, which is currently being rejected, is a good trigger. The main ceiling is 18.865, where you can make your purchase, and your first target would be 42.575.
📈 Daily Timeframe
In the daily timeframe, after breaking through the 9.394 resistance, we had a good upward movement reaching 18.664, which has been a profitable move. It was logical to withdraw your initial capital when your investment doubled, leaving the rest of your coins free of charge.
After rejecting the 18.664 resistance, breaking the temporary 15.289 support, we moved toward 12.501, and after pulling back to 15.289, we formed a lower high than 18.664 and are now back at this critical support.
On the other hand, the 12.501 support zone aligns with the 0.382 Fibonacci level, which is of great importance. If we rebound from here, we can experience a good upward movement. However, breaking this support could lead to lower levels, such as 9.394.
The key point about UNI compared to other altcoins is that it is currently above a higher support level than the rest of the market.
If we fake out the 12.5 support, it’s a good trigger for entry , If we rebound from this support and break the 15.289 resistance, you can buy with a 12.5 stop loss , If you miss these two triggers, buy after breaking the 18.664 resistance with a confirmed 12.5 stop loss.
If none of these three scenarios are activated and the price moves toward lower levels like 9.394, I will update the analysis for you after the downward wave's momentum decreases and provide a new trigger.
Breaking the 12.5 support can also serve as a trigger for opening a futures position in lower timeframes, but don’t forget about profit-taking and small stop-losses. Overall, this is a chart worth having on your watchlist.
📝 Final Thoughts
Stay calm, trade wisely, and let's capture the market's best opportunities!
This analysis reflects our opinions and is not financial advice.
Share your thoughts in the comments, and don’t forget to share this analysis with your friends! ❤️
UNIUSDT trade ideas

Why I think UNI can be bullish despite the bearish pattern!BINANCE:UNIUSDT
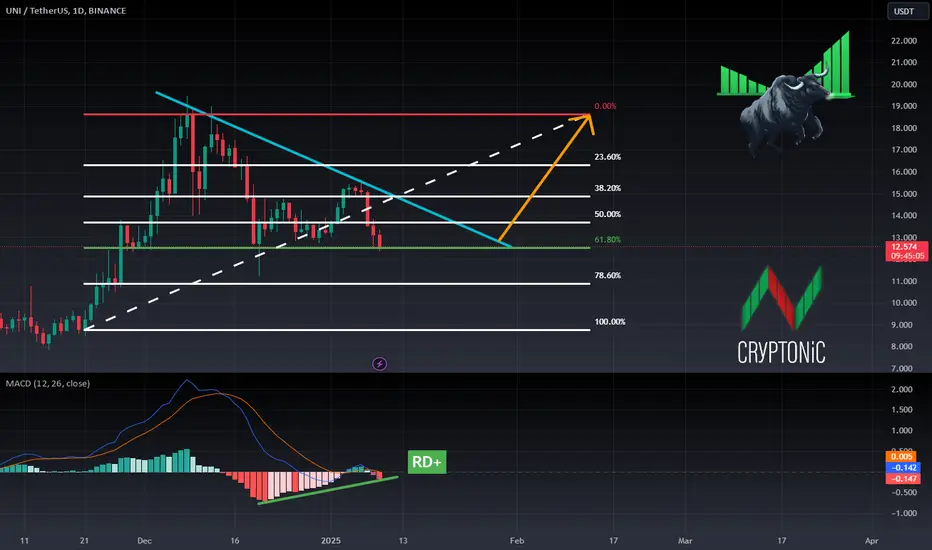
UNI is in a bearish pattern(Descending triangle!) but I think the price will increase cause I see some bullish stuff going on:
1-Bullish divergence on MACD
2-0.618 (61.8%) of the Fibonacci retracement shows a positive reaction for UNI so this might be a turning back point for it!
⚠️ Disclaimer:
This is not financial advice. Always manage your risks and trade responsibly.
👉 Follow me for daily updates,
💬 Comment and like to share your thoughts,
📌 And check the link in my bio for even more resources!
Let’s navigate the markets together—join the journey today! 💹✨
UNI/USDT hit the targets perfectly hooray!UNI/USDT hit the targets perfectly hooray!
Everyone who followed my analysis can now book a whopping profit of 35.3% with 10x leverage. As always, we partially closed our position at every 10% profit milestone while moving the stop-loss to breakeven.
For more free trade ideas like this, follow me here: @wsaetos .
Don’t forget to boost this post if you enjoyed this trade.
Stay tuned for more updates!"

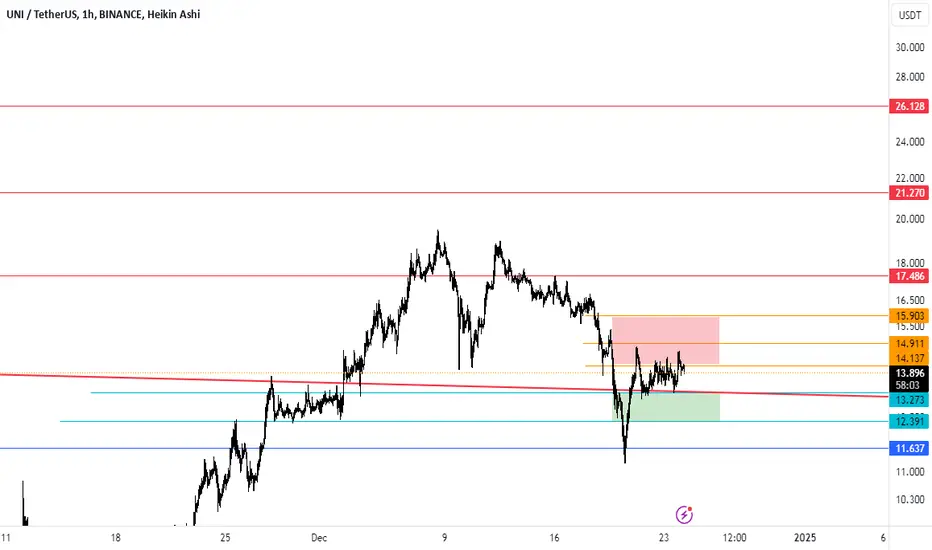
UNI/USDT Short PositionThis chart illustrates a short position on UNI/USDT following a potential bearish breakout from an ascending wedge pattern. The price action has been respecting the upper and lower trendlines, forming higher highs and higher lows. However, the breakdown below the lower support trendline signals a reversal.
Key Levels
- Entry Price: Near 13.90 (just below the breakdown point)
- Stop Loss: Around 14.27 (above the wedge resistance)
- Take Profit Target: 12.12 (aligned with key support levels and pattern height projection)
Technical Insights
Rising Wedge Pattern: Typically bearish, indicating weakening bullish momentum before a potential decline.
Bearish Confirmation: The strong bearish candlestick closing below the wedge support adds confidence to the short setup.
Risk-to-Reward Ratio : This trade offers a favorable R:R, approximately 1:2.5, making it an attractive short opportunity.
Watch for additional confirmations like increasing volume on the breakdown or retests of the former support turned resistance to add confluence.

Breaking: Uniswap Surges 5% Following Uniswap v4 AnnouncementUniswap's native token, CRYPTOCAP:UNI , has experienced a 5.34% surge following the confirmation of Uniswap v4's launch in 2025. This development comes after a successful testing phase in 2024, further solidifying Uniswap's position as a leader in the decentralized exchange (DEX) ecosystem.
A DeFi Powerhouse
Since its inception, Uniswap has played a pivotal role in the DeFi landscape. With a total value locked (TVL) of $6.143 billion and a market capitalization of $8.582 billion, the platform continues to demonstrate its significance. Here's a breakdown of liquidity across various chains:
- Ethereum: $4.824 billion
- Base: $625.98 million
- Arbitrum: $355.36 million
- Polygon: $123.59 million
- Optimism: $69.28 million
- BOB: $38 million
- BSC: $29.38 million
- Celo: $26.11 million
- Avalanche: $16.9 million
These figures underscore Uniswap's dominance and its ability to offer seamless token trading across multiple chains. Its liquidity depth and reliability make it a cornerstone of the DeFi sector, providing traders with confidence and security.
Long-Term Contender
Uniswap's consistent performance and innovative upgrades position it as a long-term contender in the crypto space. The launch of Uniswap v4 is expected to bring enhanced features and functionalities, further cementing its role as a leader in the decentralized finance industry.
Technical Analysis
At the time of writing, CRYPTOCAP:UNI is trading within a bullish reversal pattern, up 5.23% for the day. The Relative Strength Index (RSI) stands at 52.44, indicating growing momentum and room for further upside.
Key Levels
- Pivot Point: The one-month high, aligning with the $20 level, serves as a significant resistance point. Breaking this level could signal a major rally.
- Support: The 65% Fibonacci retracement level provides a crucial support zone, which could act as a retest level before a potential breakout.
Outlook
The technical indicators suggest that CRYPTOCAP:UNI has the strength to break out of its bearish zone and capitalize on its recent bullish momentum. Investors should monitor these levels closely as the token prepares for its next major move.
Conclusion
The announcement of Uniswap v4 has reignited interest in CRYPTOCAP:UNI , showcasing its resilience and potential for growth. With its robust TVL, cross-chain liquidity, and upcoming upgrades, Uniswap remains a cornerstone of the DeFi space. The current technical setup presents an opportunity for traders and long-term investors alike, as CRYPTOCAP:UNI positions itself for further gains.
Key Takeaway
Uniswap's commitment to innovation and its strong market presence make it a standout in the crypto space. As CRYPTOCAP:UNI navigates this bullish phase, it serves as a reminder of the platform's integral role in shaping the future of decentralized finance.

UNI/USDT Analysis#UNI/USDT Analysis
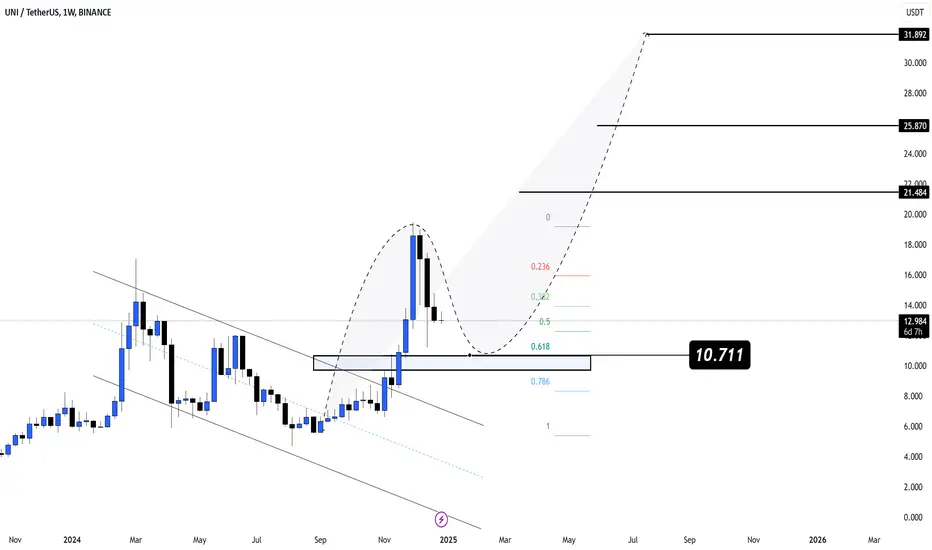
CRYPTOCAP:UNI has retraced to the 0.618 Fibonacci level, a historically strong support zone for bullish reversals.
The price is consolidating above $10.711, confirming this area as a critical level to watch.
Projected Targets 📈
✔️ Target 1: $21.484
✔️ Target 2: $25.870
✔️ Target 3: $31.892
uniusd is a bullish signal, im loking for buyWave 4 is complete, and we're now awaiting confirmation. Expecting a profit of no less than 200%.

uniIn the short term, it is circulating in these two areas. If the red box breaks, it can go again to touch the remaining areas in the medium term. If it fails, we will return to the blue line.
Uniswap (UNI)UNI/USDT Analysis 📊
UNI is one of the significant assets in the cryptocurrency world, attracting considerable attention from investors due to its high trading volume and dynamic network. This analysis aims to examine UNI's price movement within an ascending channel and highlight potential trading opportunities:
⚖️ Current Status:
Recent Correction:
After hitting the top of the ascending channel, UNI has corrected towards the 0.5 Fibonacci level (between $11.5 and $11.1), which overlaps with the channel's middle line.
This overlap is significant for traders, as it confirms the strength of support and resistance in this range.
Key Supports:
Two grey zones at the bottom of the chart are considered vital support areas:
$5.2 to $6
$3.6 to $4
These zones are recognized as strong support areas due to the multiple reactions of the price in the past. In UNI's trading history, these levels have successfully prevented sharp declines and have created high demand in these ranges. Additionally, the presence of large buyers in these areas shows their credibility.
RSI and Divergences:
The RSI is currently in an ascending channel, but it recently reversed before reaching the top of the RSI channel, forming a negative divergence. In the past, such divergences have often led to temporary corrections or even trend reversals in UNI's price. These behaviors suggest that traders should pay close attention to these signals, as they could play a key role in trading decisions.
This divergence indicates that a temporary price correction may occur or even a signal for a broader trend change.
🔎 Potential Scenarios:
Bullish Scenario:
If the price manages to stabilize above the red resistance zone (weekly resistance):
Fibonacci targets become attainable:
1.618 Fibonacci: $22 to $24
2.272 Fibonacci: $37 to $41
2.618 Fibonacci: $49 to $61
Bearish Scenario:
If the price fails to stabilize above the red resistance zone:
A correction down to the 0.618 Fibonacci level (between $9.4 and $10.3) is likely.
If the Fibonacci levels break down, the price may drop towards the bottom of the ascending channel (between $7.2 and $8).
⚡️ Key Takeaways:
Price stabilization above the red resistance zone is crucial for continuing the upward trend. Factors like increasing trading volume while attempting to break this resistance and positive news regarding UNI or the crypto market could assist in breaking this level. Indicators to watch include the formation of strong bullish candlesticks, significant volume spikes, and positive divergence in technical indicators like RSI.
Pay close attention to the negative RSI divergence, as it may signal a deeper correction.
The grey support zones will act as primary price defenses.
Traders should closely monitor price behavior near the middle line of the channel.
A strong breakout above the red resistance zone with high volume could confirm an entry signal.
🔔 Summary:
In the UNI analysis, the price behavior at the red resistance zone is key. If this resistance is broken, higher targets are expected. However, if the price fails to break this resistance, a correction towards lower Fibonacci levels and even the bottom of the channel is possible. Additionally, the RSI divergence serves as a warning for traders to follow the market's behavior more cautiously.
🔴 Practical Recommendation:
Traders should enter the market with a risk management strategy, and diversifying their capital can be highly beneficial to avoid unexpected risks. Furthermore, stay updated with analysis revisions.
⏰ Stay tuned for further updates and more detailed analysis!

UNIUSDT | Another Big Opportunity
You can see my latest UNIUSDT analysis here, it's in %60 profit. I told that I will hold till 40$ and I'm still behind it.
Mastery, creates history.
And here is another trade.
Blue box is high probability demand zone.
Price didn't make a new high, it might need some rest.
I keep my charts clean and simple because I believe clarity leads to better decisions.
My approach is built on years of experience and a solid track record. I don’t claim to know it all, but I’m confident in my ability to spot high-probability setups.
My Previous Analysis
🐶 DOGEUSDT.P: Next Move
🎨 RENDERUSDT.P: Opportunity of the Month
💎 ETHUSDT.P: Where to Retrace
🟢 BNBUSDT.P: Potential Surge
📊 BTC Dominance: Reaction Zone
🌊 WAVESUSDT.P: Demand Zone Potential
🟣 UNIUSDT.P: Long-Term Trade
🔵 XRPUSDT.P: Entry Zones
🔗 LINKUSDT.P: Follow The River
📈 BTCUSDT.P: Two Key Demand Zones
🟩 POLUSDT: Bullish Momentum
🌟 PENDLEUSDT: Where Opportunity Meets Precision
🔥 BTCUSDT.P: Liquidation of Highly Leveraged Longs
🌊 SOLUSDT.P: SOL's Dip - Your Opportunity
🐸 1000PEPEUSDT.P: Prime Bounce Zone Unlocked
🚀 ETHUSDT.P: Set to Explode - Don't Miss This Game Changer
🤖 IQUSDT: Smart Plan
⚡️ PONDUSDT: A Trade Not Taken Is Better Than a Losing One
💼 STMXUSDT: 2 Buying Areas
🐢 TURBOUSDT: Buy Zones and Buyer Presence

UNI Approaches Oversold Territory With Breakout Potential AheadBINANCE:UNIUSDT has struggled to maintain bullish momentum, retreating from its highs to test key levels. Resistance lies at $13.011 and $13.155, while support is seen at $12.801 and $12.654. The narrowing price band hints at potential breakout volatility.
The 9 EMA trending below the 20 EMA underscores bearish conditions. The MACD histogram reveals decreasing bearish momentum, indicating a possible reversal. RSI readings in the oversold zone suggest that buyers might soon regain control.
Trading Strategy: Short positions could be placed near $13.011, targeting $12.654, with stops above $13.155. Long traders might enter near $12.801, aiming for an upward move toward $13.155.

#UNI/USDT Ready to go higher#UNI
The price is moving in a descending channel on the 1-hour frame and sticking to it well
We have a bounce from the lower limit of the descending channel, this support is at 14.00
We have a downtrend on the RSI indicator that is about to be broken, which supports the rise
We have a trend to stabilize above the 100 moving average
Entry price 14.50
First target 15.00
Second target 15.61
Third target 16.35

UNIUSDT 1WUNI Update ~ 1W
#UNI If you still have Conviction on this coin,. Buy gradually within this support block,. With a short term target of at least 20%++. This coin is still in a bullish trend

UNIUSDTWe can attempt to buy UNIUSDT from specified level as it make HL , also 0.618 FIB level intact indicate that it moves upward.
SL , TP mention in chart.

UNI/USDT : Bouncing back from support, Eyeing a bullish reversalUNI/USDT: Bouncing Back from Trendline Support, Eyeing a Bullish Reversal
UNI/USDT is showing promising signs of recovery 📈 as it rebounds from a critical trendline support zone 📊. This bounce could signal the start of a strong bullish reversal 💥 if momentum continues to build. With market sentiment shifting, this pair is one to watch closely 👀 for potential opportunities.
Key Insights:
1. Trendline support: UNI/USDT has respected a long-standing trendline, which has historically provided strong support. A rebound from this level suggests buyer confidence is returning.
2. Volume uptick: Monitor for increasing trading volume during the bounce to confirm the strength of buyers 🔥.
3. Bullish signals: Momentum indicators like RSI and MACD are turning upwards ⚡, adding to the case for a potential bullish move.
Steps to confirm the reversal:
Look for a series of higher highs and higher lows on the 4H or daily timeframe 📍.
A spike in trading volume during the bounce will reinforce buyer activity 📊.
Watch for price testing the next resistance zone—if it breaks through, it could confirm a trend shift ✅.
Be cautious of false recoveries or sharp sell-offs that breach the trendline ⚠️.
Risk management strategies:
Place stop-loss orders just below the trendline support to protect against unexpected breakdowns 🔒.
Adjust position sizes to fit your overall trading strategy and risk tolerance 🎯.
This analysis is for educational purposes only and not financial advice. Always conduct your own research (DYOR) 🔍 before making any investment decisions.

TradeCityPro | UNI : Maintaining Bullish Momentum👋 Welcome to TradeCityPro!
In this analysis, I’m going to review the UNI coin. The Uniswap project is a decentralized exchange (DEX) with one of the highest Total Value Locked (TVL) in DeFi. It has a native token named UNI.
📅 Daily Timeframe: Breakout of the Key High Wave Cycle Resistance
On the daily timeframe, after the price first reached the 14.895 resistance level, it was rejected and entered a downtrend, eventually hitting the 5.591 support with a Selloff candle.
📈 Once the price reached this support, the market momentum gradually shifted, and after breaking through the 8.403 resistance, momentum turned fully bullish. Even the key resistance of 14.895 was surpassed, pushing the price to the 18.979 zone.
🔽 After initially reaching the 18.979 resistance, the price showed a corrective candle, retracing back to 14.895 as a pullback. Following this, the price rallied again to 18.979, maintaining its upward momentum.
📊 Throughout this upward movement, the volume has consistently confirmed the trend and shown convergence. Additionally, after breaking 8.403, the RSI oscillator entered the Overbuy zone, indicating the bullish momentum is intact.
🚀 If 18.979 is broken, the major resistance levels to watch are 28.968 and 43.088. While there are additional resistance zones along the way, these two hold greater significance.
📉 Correction Scenario
In the event of a correction, the first significant level is 14.895, which has already acted as a pullback zone once. A deeper correction could see the price revisiting the 8.403 support.
✨ If this level is broken, market momentum will likely turn bearish. In such a case, the 5.591 and 3.857 levels will serve as the final strongholds for UNI.
📝 Final Thoughts
This analysis reflects our opinions and is not financial advice.
Share your thoughts in the comments, and don’t forget to share this analysis with your friends! ❤️

Analysis and review of UNISAWPHello dear friends
We are at your service by analyzing and reviewing a coin from the DEFI field.
Coin of the decentralized exchange UNISAWP, which is a very, very potential coin.
This coin has expected movements, as you can see, it was suffering for a long time, now that the decentralized exchanges are speaking first, it was able to get out of the suffering and make an upward movement, but this is just the beginning of the story...
After his rise, he made a good pullback and due to the rounding of the trend, he gives us this signal that a big rise is happening.
If you have this currency, we suggest that you keep it.
But if you are looking for a buying opportunity, you can make a buying step here and wait to buy in the specified areas if the market corrects.
Note that this coin has a good future...

bearish bat patternA bearish bat pattern has been confirmed and according to the situation of smart money, it has a high probability to reach the first target. I hope you are lucky.

UNI UPDATE 10/12/2024### Technical Analysis for UNI
Current Support Levels:
- $13.5 / $12.8: These levels are crucial support zones where buyers have historically stepped in to prevent further decline. A bounce from here could indicate strong buying interest.
- $10.85: This is a significant lower support level. If UNI drops towards this area, it may present an even stronger buying opportunity if the price holds.
- $45: This is our target for the current bull run. However, reaching this level requires overcoming previous resistance levels and sustained bullish momentum.
Price Action:
- After recent consolidations around the support levels mentioned, UNI shows signs of potential bullish momentum as it retests the $13.5 and $12.8 areas.
- Volume spikes during upward moves will indicate buyer strength, while low volume on declines would suggest a lack of selling pressure.
Moving Averages:
- 50-day & 200-day Moving Averages: Watching these moving averages will help gauge longer-term trends. A bullish crossover (where the 50-day crosses above the 200-day) often signals a continuation of upward momentum.
Indicators:
- RSI (Relative Strength Index): If the RSI is moving out of the oversold region and heading towards the midpoint, this can imply a potential reversal or continuation of the bullish trend.
- MACD (Moving Average Convergence Divergence): A bullish MACD crossover can signal momentum building in the upward direction.
### Summary:
With critical support areas at $13.5, $12.8, and $10.85, and the potential to reach $45 in this bull run, this is a moment to consider entering or adding to your positions in UNI. Always remember to employ proper risk management and conduct your own research before making trading decisions.
Happy trading! 🚀📈

UNI/USDT - Potential Bullish Setup with Key Support LevelsChart Analysis: The Uniswap (UNI/USDT) chart is currently presenting a potential bullish setup with strong support levels in the range of $12.5 - $13.5 and $9.2 - $10. Given these support zones, we anticipate a solid reversal towards a potential price target of $39 - $40.
Key Levels to Watch:
Support Level 1: $12.5 - $13.5
This zone has historically shown resilience and could provide an ideal entry point for a bounce higher. If the price dips into this range and starts to show signs of consolidation or bullish reversal signals (like candlestick patterns or momentum indicators), it might present a favorable risk/reward ratio for long positions.
Support Level 2: $9.2 - $10
This is a secondary support zone, where price could be tested before making a more significant rebound. Should the price reach this level, it could offer an even better entry point with a higher risk/reward setup.
Bullish Target: $39 - $40
The long-term price target is in the $39 - $40 region, where we anticipate a significant price move. This target is based on previous resistance levels, technical projections, and the overall market sentiment towards UNI.
Trade Setup:
Entry: Look for confirmation at either of the support zones mentioned above. A bullish reversal pattern (e.g., a hammer candle, engulfing pattern, or RSI divergence) could confirm an entry.
Target: The main target is the $39 - $40 range.
Stop-Loss: Below the support zones, depending on where you enter.
Conclusion:
UNI/USDT has the potential to make a strong move up if it holds key support levels. With clear entry points at $12.5 - $13.5 and $9.2 - $10, traders can position themselves for a move toward the $39 - $40 area, following a risk-managed approach.

Bitcoin is a little overbought now and the table is turning.....For those who had missed the Bitcoin rally, fret not ! The market always offer us opportunities if we bother to do our research. I have no idea how much more Bitcoin will continue its rally , maybe 80,90 or even 100k. But once that level is breached, it will goes sideway to form a consolidation.
That is the time when altcoins will come into play and start their rally. This is a speculative play for me so I will be taking a small position only and with stop loss.
Please DYODD

#UNI #USDT Short Set UpLooks like we will have a short term reversal. Shorting on the break of 17.085
Entry 17.085
Stoploss 18.954
TP-1 15.216
TP-2 13.347

UNI has a very good investment opportunity Hi Everyone;
today we have one of the best risk to reward Investment opportunity
it is more than 500 times the risk and the chart is look very promising.
I expect breaking the previous bear market key point will clear the way to the final target
