UNI is bearishThe structure is bearish on large time frames.
The liquidity pools in the upper part of the chart have been swept and now the price is going to move towards the liquidity pools in the lower part of the chart.
The short-term target is the demand range.
In the long term, our buy position is the place we specified at the bottom of the chart.
Closing a daily candle above the invalidation level will violate the analysis
Note that the financial market is risky, so:
Do not enter a position without setting a stop and capital management and confirmation and trigger.
When we reach the first TP, save some profit and try to move the stop continuously in the direction of your profit.
If you have any comments please post them, comments will help us improve our performance
Thanks
UNIUST trade ideas

UNI (Uniswap): Approaching SupportTrade setup : Price got rejected at $12 resistance three times (Triple Top) and pulled back below 200-day MA (~$9.00), which is a sign of downtrend. We wait for price to regain those critical levels and signal resumption of uptrend. Uniswap is the biggest DEX – see On-chain data, and has been a beneficiary of the move to decentralized exchanges and non-custody trading solutions.
Pattern : Price is Approaching Support , which is a level where it could pause or reverse its recent decline, at least temporarily. Support is often a level where price has bounced up in the past, or potentially prior Resistance level that was broken. (concept known as polarity). Once price breaks below support, it can move lower to the next support level. Learn to trade key levels in Lesson 7.
Trend : Short-term trend is Strong Down, Medium-term trend is Strong Down and Long-term trend is Strong Up.
Momentum is Bearish but inflecting. MACD Line is still below MACD Signal Line but momentum may have bottomed since MACD Histogram bars are rising, which suggests that momentum could be nearing an upswing. Price is neither overbought nor oversold currently, based on RSI-14 levels (RSI > 30 and RSI < 70).
Support and Resistance : Nearest Support Zone is $8.00, then $6.75. Nearest Resistance Zone is $10.00, then $12.00.

UNI waiting for confirmationUNI might go down further, based on traingle pattern. It might see 7 again and will try to go up from there. If not we might go down further to 6.75 and then have to wait if we can see newer LL.
This is no fiancial advice, always DYOR.
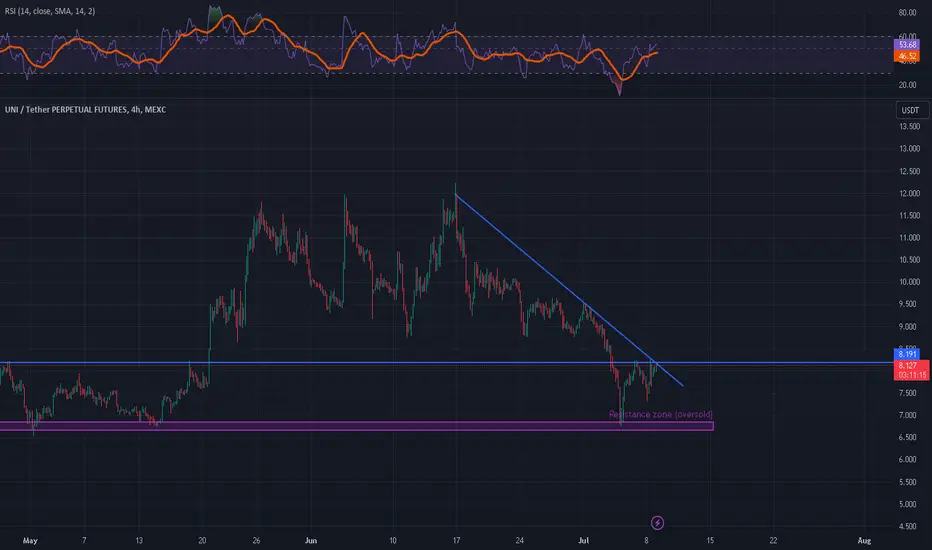
UNIUSDT.. only area, hold or not ??#UNIUSDT.. well guys market bounced back and now at his one n only area 8.25 you can say resistance.
Keep close it it's our pattern level with a trend line.
If market hold it then drop expected from here.
Don't be lazy here ... Only selling invalidate above 8.25 closings.
Good luck
Trade wisely

UNI (Uniswap): Approaching SupportTrade setup : Price got rejected at $12 resistance three times (Triple Top) and pulled back below 200-day MA (~8.91), which is a sign of downtrend. We wait for price to regain those critical levels and signal resumption of uptrend. Uniswap is the biggest DEX – see On-chain data, and has been a beneficiary of the move to decentralized exchanges and non-custody trading solutions.
Pattern : Price is Approaching Support , which is a level where it could pause or reverse its recent decline, at least temporarily. Support is often a level where price has bounced up in the past, or potentially prior Resistance level that was broken. (concept known as polarity). Once price breaks below support, it can move lower to the next support level. Learn to trade key levels in Lesson 7.
Trend : Short-term trend is Strong Down, Medium-term trend is Down and Long-term trend is Strong Up.
Momentum is Bearish (MACD Line crossed below MACD Signal Line) BELOW days ago. Price is neither overbought nor oversold currently, based on RSI-14 levels (RSI > 30 and RSI < 70).
Support and Resistance : Nearest Support Zone is $6.75. Nearest Resistance Zone is $10.00, then $12.00.

Uniswap Coin (UNI): Good Short Incoming!!!Uniswap is yet another coin pressuring the major neckline zone (which, upon breaking, would result in a massive movement to lower zones).
We are looking for that break to happen this week (most likely) and as soon as we get that breakdown, we will be looking for entry into this position!
Swallow Team

UNIUSDT Potential DownsidesHey Traders, in today's trading session we are monitoring UNIUSDT for a selling opportunity around 7.60 zone, UNIUSDT is trading in a downtrend and currently is in a correction phase in which it is approaching the trend at 7.60 support and resistance area at 7.60 support and resistance area.
Trade safe, Joe.

UNIUSDT Losing Momentum for a Further Downward Move? Yello, Paradisers! Let’s dive into the latest analysis of #Uniswap (#UNI) and see what might be next for #UNIUSDT.
💎#UNIUSDT has been trading within a falling wedge formation on the 12H timeframe. This pattern is generally considered bullish, but current market conditions suggest caution. Currently, #Uniswap is retesting the falling wedge's lower support level, and there is a possibility that it might drop further.
💎The failed breakout from the falling wedge reinforces a bearish bias. If BME:UNI fails to break above the resistance level, the downward trend could continue.
💎The diminishing trading volume and the Point of Control (POC) of the Volume Range Volume Profile (VRVP) acting as resistance increase the likelihood of a further drop. If #UNI fails to hold the support at the falling wedge's lower boundary, it is likely to retest the major support zone around $7.00.
💎The key support zone, which has been tested and respected multiple times, lies between $6.40 and $7.00. If UNI fails to hold at these levels, the next major support to watch is at $5.886. This area is critical as it is packed with liquidity and can create a good chance of a pullback if tested.
💎The bearish invalidation level is marked above the resistance at $9.459. A break and close above this level could invalidate the bearish scenario and potentially lead to a bullish rally.
Stay focused, patient, and disciplined Paradisers
MyCryptoParadise
iFeel the success🌴

UNI support level breakout The price is forming a falling wedge pattern, and we may see a break of this pattern soon.he price is expected to act as before and rise again to retest the minor resistance area at $11.998. If the price can reach that area again, it will probably break it and move towards the next resistance.
If the price drops below the support level, the bullish scenario will be completely violated. Therefore, keeping the price above this level is very important

UNI/USDT Technical Analysis in Daily Timeframe.Hello everyone, I’m Cryptorphic.
For the past seven years, I’ve been sharing insightful charts and analysis.
Follow me for:
~ Unbiased analyses on trending altcoins.
~ Identifying altcoins with 10x-50x potential.
~ Futures trade setups.
~ Daily updates on Bitcoin and Ethereum.
~ High time frame (HTF) market bottom and top calls.
~ Short-term market movements.
~ Charts supported by critical fundamentals.
Now, let’s dive into this chart analysis:
A couple of weeks ago, UNI was rejected from the $12 price level, forming a resistance trendline. Currently, the price is at $9.175, holding decent support at the 200EMA ($8.76).
After the rejection, UNI has yet to hit the supporting trendline at $7.33, indicating a potential further 20% drop if the price doesn't hold the 200EMA.
Here are some key observations:
~ Primary Support- 200EMA at $8.76.
~ Lower Support- $7.33.
~ Crucial and decisive point- 200EMA at $8.76.
~ Invalidation point- Break down below the lower support.
~ Best Entry: $7.29 to $7.81.
DYOR. NFA.
Please hit the like button to support my content and share your thoughts in the comment section. Feel free to request any chart analysis you’d like to see!
Thank you!
#PEACE

UNI priceThe Uniswap (UNI) price faced severe rejection from the supply zone of 12 and erased over 25% of gains this month.

UNIUSDT is Approaching The Down TrendHey Traders, in today's trading session we are monitoring UNIUSDT for a selling opportunity around 10.200 zone, UNIUSDT is trading in a downtrend and currently is in a correction phase in which it is approaching the trend at 10.200 support and resistance area.
Trade safe, Joe.

UNIUSDT - where is current support? Hold??#UNIUSDT.. well guys, 2 things are important now, first pattern area that is 8.24 around
And 2nd trend line.
Both are in favour of buying. So keep close 8.24 means around 8 and if market hold it then bounce expected.
Below 8 buying will be invalidated.
Good luck
Trade wisely

Heavy Market Drop: Bitcoin and UNI Analysis🔍Let's dive into today's analysis. The market experienced a significant drop, especially Bitcoin. Altcoins also fell, but since Bitcoin's dominance decreased, Bitcoin's drop was more substantial than that of altcoins. Today, I want to analyze UNI, which has dropped less than Bitcoin. But first, let's look at Bitcoin's analysis.
👑 Bitcoin Analysis
🔍 We're analyzing Bitcoin on the 1-hour timeframe. As you can see, after breaking 64,247, which was a trigger mentioned in previous analyses for short positions, the descending channel was broken from below. This can lead to two scenarios:
Trend Fatigue: The price may re-enter the channel.
Sharp Downtrend: The price may continue a sharp downtrend, which happened in this case with a 9% drop to the 58K low. It was then supported at 59,323 and is currently ranging around 61,300.
🔄 I hope you utilized the short triggers mentioned in previous analyses. Our triggers were 64,247 and 63,583, and with a break strategy, you could have easily taken a position with a risk-to-reward ratio of 5 to 20, depending on which trigger and stop-loss size you used.
📊 The selling volume in the market has increased significantly, and as the price takes a breather, the current buying volume is negligible compared to the selling volume during the downtrend, indicating the strength of the bearish trend.
📈 I am not recommending any long positions because it's illogical to open long positions when the market has such a strong bearish momentum.
📉 For short positions, we currently have the 59,323 trigger. If you want to enter earlier, you can use Dow Theory and open a short position whenever a lower low is made. I believe the price will wait for the SMA 99 to catch up since it's quite far from the current price.
📚 Bitcoin Dominance
Let's look at Bitcoin dominance. As I mentioned, Bitcoin's larger drop compared to altcoins is due to the decline in Bitcoin's dominance. This chart shows the percentage of money in the crypto market that is in Bitcoin.
🔑 Yesterday, with the break of 55.06%, Bitcoin dominance dropped, causing money to flow out of Bitcoin into altcoins. Part of this money became Tether, and part went into altcoins, causing both Bitcoin and altcoins to drop, but Bitcoin more so. Currently, dominance is ranging between 53.74% and 56.31%. With a break of the 55.06 trigger, it can move to the lower end of the range.
🦄 UNI Analysis
🔍 Now, let's analyze UNI. I've previously discussed the Uniswap project and its court case with the US in detail, so let's go straight to the chart.
🔄 In the previous analysis, I mentioned that you could open a long position with a break of 11.567, but a fake breakout occurred, and the price couldn't stabilize above this area. Subsequently, the price dropped past the POC fixed range volume profile and continued down to the 6.412 area. After a brief consolidation, it dropped again to the box low of 8.871.
📉 For shorts, the 8.871 trigger is very suitable, especially if Bitcoin dominance increases, making it a great short trigger. The target for this move could be 8.226, and after that, 6.768. A break of 26.35 in RSI could introduce bearish momentum into the market, making lower targets achievable.
📈 For longs, wait for the price to build a new structure. Until then, wait for a break of 10.82, which overlaps with the POC.
📝In conclusion, the market has shown a significant bearish movement, especially in Bitcoin, which has led to cautious market sentiment. For Bitcoin, short positions remain more favorable due to the strong bearish momentum. For UNI, the short trigger of 8.871 is a key level to watch, while long positions should be approached with caution, waiting for a more defined structure and stronger buying signals. Always ensure to manage risk and wait for clear triggers before entering positions.

🦄 UNI Long 🦄if everything remains the same, there is a high probability that UNI will continue in the bullish channel .
It passed the 38.2 Fib Fan level, I would expect it to reach 61.8 at least
What do you think?

UNI - Playing around the resistance level#UNI/USDT #Analysis
Description
---------------------------------------------------------------
+ UNI's price is currently moving towards the resistance level around $14-$16.
+ If this resistance is broken, the price could head towards the next resistance around $30.
+ The subsequent resistance level is around $45, which is UNI's previous all-time high (ATH).
---------------------------------------------------------------
VectorAlgo Trade Details
------------------------------
Entry Price: 11.36
Stop Loss: 8
------------------------------
Target 1: 14
Target 2: 22
Target 3: 30
Target 4: 45
------------------------------
Timeframe: W
Capital Risk: 1-2% of trading amount
Leverage: 5-10x
---------------------------------------------------------------
Enhance, Trade, Grow
---------------------------------------------------------------
Feel free to share your thoughts and insights.
Don't forget to like and follow us for more trading ideas and discussions.
Best Regards,
VectorAlgo

Uniswap Coin (UNI): Pattern is Similar / Drop Incoming?Uniswap is showing similar patterns where we are monitoring both 100EMA and the middle line of Bollinger bands.
All information is on the image so there is nothing much to say here, rather than waiting for final confirmations for further movement to lower zones!
Swallow Team

UNI is one of the stronger charts . UNI is one of the stronger charts I saw this morning.
its been holding the W structure well while rest of the market been bleeding and now is set up for enough space for a 4h HL in 15 OS.
could be rounding out ont he daily, which means accumulation, lets see.
If BTC goes lower can UNI hold the lows ? or will it dip below
Among my main ALTS currently. UNI PENDLE PEPE MKR BNB ( and maybe later JASMY for W HL in 4h OS. )

Uniswap (UNI) Soars: A Bright Spot in a Subdued Market
The cryptocurrency market has experienced a period of relative calmness in the past week. However, amidst this subdued landscape, Uniswap (UNI), the native token of the leading decentralized exchange (DEX) Uniswap, emerged as a bright spot. According to CoinDesk Indices' bi-weekly market update, UNI led the CoinDesk 20 (CD20) Index with a stellar 6.8% advance. This surge propelled the token's price above $11, a significant increase from its price of $7 just one month ago.
Understanding the CoinDesk Indices
The CoinDesk Indices (CDI) serve as valuable benchmarks for tracking the performance of various digital assets. The CD20 specifically focuses on the top 20 digital assets by market capitalization, offering a snapshot of the health of the leading cryptocurrency projects. UNI's impressive gain atop the CD20 leaderboard highlights its outperformance compared to other major players in the market.
Factors Potentially Contributing to UNI's Rise
While the exact reasons behind UNI's recent surge remain debatable, several factors could be at play:
• Increased DEX Usage: The decentralized finance (DeFi) space, where Uniswap reigns supreme as a DEX leader, has witnessed a resurgence in user activity in recent months. This could be driving demand for UNI as users require the token for governance and transaction fee discounts on the Uniswap platform.
• Potential Speculative Interest: The broader cryptocurrency market might be experiencing a shift in investor sentiment towards DeFi projects. UNI, as a prominent token within the DeFi sector, could be benefiting from this speculative interest.
• Developments on the Uniswap Protocol: The Uniswap team might have introduced new features or upgrades to the protocol that have garnered positive attention from the crypto community. This could be attracting new users and investors to the platform, thereby increasing demand for UNI.
A Look at the Broader Market Context
It's important to remember that UNI's rise occurred within a relatively muted market environment. The CoinDesk Market Index (CMI), a broader index encompassing roughly 180 tokens across various sectors, did not exhibit a significant uptrend. Some leading alternative Layer 1 blockchain, like Internet Computer (ICP) and Near Protocol (NEAR), experienced price declines during the same period.
What Does This Mean for UNI Investors?
UNI's recent performance is certainly encouraging for investors holding the token. However, it's crucial to maintain a cautious and realistic perspective. The cryptocurrency market remains inherently volatile, and short-term price movements can be subject to various factors, some of which may not be entirely predictable.
Looking Forward: Where Does UNI Go from Here?
The sustainability of UNI's upward trajectory hinges on several factors. The continued growth of the DeFi ecosystem, ongoing developments within the Uniswap protocol, and broader market sentiment towards DeFi will all play a role in shaping UNI's future price performance.
Conclusion
Uniswap's (UNI) recent surge atop the CoinDesk 20 Index signifies a period of outperformance compared to other prominent cryptocurrencies. While the reasons behind this rise are multifaceted, the increasing adoption of DeFi and potential investor interest in the sector could be contributing factors. However, navigating the cryptocurrency market requires a balanced approach. Investors should stay informed about developments within the Uniswap protocol, the broader DeFi landscape, and overall market trends to make informed decisions regarding UNI. By remaining vigilant and employing sound investment strategies, investors can capitalize on potential opportunities within the ever-evolving cryptocurrency landscape.

Long trade
Pair: UNIUSDT
16th June 24
15.45pm
New York Session
15min TF Entry
Buyside
Entry 11.5114
Profit level 12.9591 (12.58%)
Stop level 11.4750 (0.32%)
Back testing...

Short trade Sun 16th June 24
8.45am
London Session
Entry 15min TF
Sell side
Entry 11.4526
Profit level 11.0834 (3.22%)
Stop level 11.4990 (0.41%)
RR 7.96
Stop reached...?
Re entry
RR 5
Entry 11.4526
Stop level 11.5508 (0.67%)
Profit level 11.0864 (3.37%)

Short trade
Sun 16th June 24
8.45am
London Session
Entry 15min TF
Sell side
Entry 11.4526
Profit level 11.0834 (3.22%)
Stop level 11.4990 (0.41%)
RR 7.96

Uniswap (UNI): At Major Resistance!Uniswap coin is in a major resistance zone after having a massive liquidation movement.
This liquidity movement was stopped just right at the resistance zone, where UNI is finding it hard to breakout, which is logical as well.
If all plays out nicely, we should see some kind of correctional movement after that huge green daily candle.
Swallow Team
