BUY IDEA UNI/USDTFrom the specified support range, we can expect a reaction in the direction of buying in two stages
UNIUST trade ideas

UNI/USDT: Bullish Momentum Post-ETH ETF News, 1:2 R/RUNI/USDT is showing promising signs of continued bullish momentum following news of an ETH ETF approval. The recent consolidation and shakeout of long positions have set the stage for further upside. Targeting a risk/reward ratio of 1:2, this setup aims to capture gains as the market reacts positively to the developments. Entry is recommended now to capitalize on the upward trend expected to renew local highs. Keep a close watch on volume and price action to manage the trade effectively.


UNI/USDT Breakout alert!! Indicating bullish momentum for UNI. 💎Paradisers, #UNI is indeed a coin worth monitoring closely.
💎 UNI has successfully broken out of the reaccumulation resistance, signaling bullish momentum for further upward movement. The current price has yet to retest the support level, previously a resistance, around the 8.27 area.
💎 However, if UNI manages to break above the supply area directly without first retesting the support, it could indicate a strong upward trend, potentially allowing the price to reach our target strong resistance area.
💎 Conversely, if UNI fails to break above the supply area and experiences a significant rejection, there's a possibility of downward movement towards the support level at 8.827. This scenario is more likely if UNI hasn't retested the support area yet.
💎 UNI must bounce off the support during the retest. Failure to do so, resulting in a breakdown below the support, would validate the bullish invalidation. In this case, the price could revisit the support of reaccumulation or even experience further decline.
MyCryptoParadise
iFeel the success🌴

Buy UNISWAP! BINANCE:UNIUSDT would aim for the first target of 12, and if it succeeds in breaking the resistance, the price will reach a value above 19 dollars. I think that UNI is definitely going through the consolidation phase. I think it is an ideal moment for buying 9.2 and selling for 12.1.
All the best!


📈UNI Market Analysis: Key Levels and Trading Strategies🎲🔍Let’s dive into today’s analysis. The market is currently resting in an uptrend, and the coin we will analyze today is one of the most reputable projects in the DeFi space—Uniswap (UNI). As a decentralized exchange, Uniswap is among the oldest and best platforms, trusted by many whales and widely accepted in the crypto community.
⏰In the 4-hour time frame, Uniswap has been trading within a large range box for over a month with very low volatility. It has recently been rejected from the top of this range and may move towards the bottom. Given the prolonged sideways movement and lack of momentum in the market, indicators and oscillators like RSI or SMA, which rely on momentum, are not reliable at this time. Therefore, we will rely solely on price action and volume to identify potential scenarios.
🧩The upper boundary of the range is at 8.226, and the lower boundary is at 6.768. We need to wait and see which level the price breaks. If the price breaks above 8.226, the market will turn bullish on the 4-hour time frame, with a target of 10.521. For short positions, you can enter if the price breaks below 6.768. It’s important to note that the price rebounding from 0.382 and moving to break 6.768 is not significant because the price has formed a new structure, and there is no momentum to push it further down. Thus, Fibonacci retracement is not applicable here.
🔫However, this does not mean we should not open positions at all, as breaking this strong and significant support could trigger another bearish move. The target for this move would be 5.671. It’s crucial to observe the volume when the box is broken. If the price breaks above the box, the buying volume should increase, and if it breaks below, the selling volume should increase.
📝In summary, Uniswap (UNI) is in a prolonged range with key levels at 8.226 and 6.768. A breakout above 8.226 could lead to a bullish move targeting 10.521, while a breakdown below 6.768 could initiate a bearish move towards 5.671. Monitoring volume is essential to confirm the direction of the breakout. Proper risk management and attention to these key levels will be vital in navigating potential trades.
🧠💼It's important to acknowledge the inherent risks in futures trading, with the potential for margin calls if risk management is neglected. Always adhere to strict capital management principles and utilize stop-loss orders, ensuring that the initial target offers a risk-to-reward ratio of 2.

#UNI/USDT breaks the diagonal Trendline in 4-Hour TF!#UNI/USDT breaks the diagonal Trendline in 4-Hour TF!
Wait for a successful retest to open a long position.
The local support level is PDH $7.6. The PMH of $13 is a local resistance level.

UNISWAP - Daily Shortterm Trend & Support/Resistence Trade SignaUNI now completed a correction and are ready to return to gain higher.
The new opportunity at the current price
🟢 Trend: Bullish 🚀
🟢 Support: $4
🟢 Target: $45
------
Current: $7.5

UNIUSDT - buy now or miss it outHi traders,
UNIUSDT printed a double bottom which is a trend reversal pattern.
Buy now or lower if the price consolidates in the buy zone for a while.
In a few weeks, we're expecting UNISWAP to reach 14,100 usdt again.
A potential scenario is shown on the chart.
Good luck

About crypto market and his perspective🤕 Robinhood and Uniswap have gotten chain letters from the SEC
As strange as it sounds - this is a green flag. The SEC can't allow cryptocurrencies to go easy if they expect interest in it to grow. Uniswap, on the other hand, gave room for fantasy laundering and tax evasion. If the SEC is thinking of regulating such an industry - there is light on the horizon for the crypto world as a decentralized cell, but as a market - huge prospects. 😵💫 Nothing can fight the unified mood of the authorities of all developed countries to control money circulation, therefore, firstly, cryptocurrencies initially had no chance to become a decentralized payment system, and secondly, the more DeFi will be chopped - the more funds will be injected into the market
🔜With this news, we expect the crypto market as a whole to continue moving upwards. UNI is holding the $7 level very well, so if the company settles the disagreements with the regulator soon - we may see a rise to $14+. I don't see any reason to go below $4, most likely the price won't fall below $6.8-7$

Uniswap(UNI): Will We Break EMAs or Get Rejected?Uniswap caught our attention, where we are seeing a really good chance of upper zones being reclaimed, where we might find a good entry for potential downward movement (rejection from upper zones).
We are keeping an eye on those EMAs, which are only zones of resistance for now, and if we see rejection near those zones, we will see further moves to lower zones; if not, then movement to the upper resistance zone!
Swallow Team

#UNI/USDT is heading towards the Diagonal Trendline in 4-Hour TF#UNI/USDT is heading towards the Diagonal Trendline in 4-Hour TF!
Wait for BO/retest to long $UNI. #UNIUSDT needs to break this trendline to gain bullish momentum. The support level is PWH $7.935 and the local resistance level is PML $10.345.

No Price Consolidation Has OccurredThe price of UNI has recently broken through the lower boundary of the orange box during a correction phase. This breach has caused the price to close below this level. If stronger bearish patterns form in this area, the price may decrease further to the lower support zone. On the other hand, price consolidation has not yet occurred on the weekly timeframe. If the price begins to rise and consolidates above the orange resistance box, an uptrend in price is expected to resume.

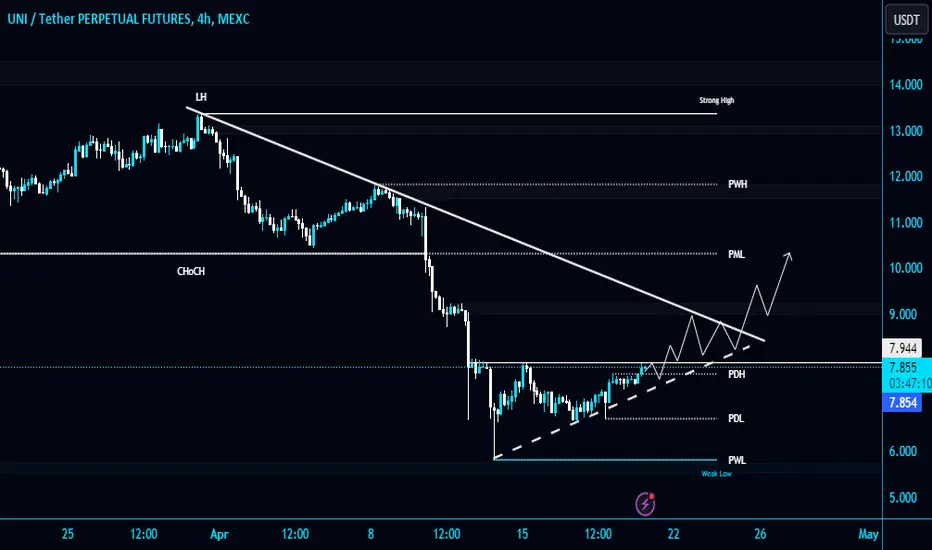
#UNI/USDT is forming Ascending Triangle in 4-Hour TF!#UNI/USDT is forming Ascending Triangle in 4-Hour TF!
BME:UNI needs to clear the Triangle resistance line to gain the bullish momentum. The next local resistance level is PML $10.31. The strong support level is PWL $5.85.
UNIUSDT TriangleTriangle pattern is good consolidation for the market. $4.80 support will be broken without any doubt... I myself going to put buy limit order around $4 level...

DCA on UNIDCA on UNI
I accumulate every time we approach or enter the green box.
Another project no one is talking about anymore... (like ANKR, FLUX, DCR...) :-)

UNI sent BACK TO PRISON 🦄⚔📉Hi Traders, Investors and Speculators of Charts📈
UNI has dropped hard after a decent increase, taking the price back to accumulation level lows.
Losing ALL THREE moving averages in the daily is bearish for the short term :
This however presents an excellent opportunity for traders to re-accumulate at low prices before the next bullish impulse wave begins.
According to Eliot Wave Theory; as long as wave 2-3 does not retrace beyond wave 0-1 the cycle can still be considered bullish. Meaning, IF we drop any lower than the current point, we'll no longer be able to consider the price as bullish.
The WHITE lower trendline may be an indication of a buy zone:
I'm labeling this post as "long", not because I am taking a leveraged long but because the price is re-entering the accumulation zone/ buy zone (SPOT).
If you found this content helpful, please remember to hit like and subscribe and never miss a moment in the markets.
_______________________
📢Follow us here on TradingView for daily updates📢
👍Hit like & Follow 👍
CryptoCheck
BINANCE:UNIUSDT

Uniswap CEO Stands Firm Amid SEC ScrutinyThe legal showdown between Uniswap ( CRYPTOCAP:UNI ) and the Securities and Exchange Commission (SEC) has sent ripples through the crypto community, reigniting the debate on tokens versus securities. CEO Hayden Adams, however, remains resolute, expressing confidence in emerging victorious from the legal tussle.
The crux of the Uniswap vs SEC lawsuit revolves around three pivotal issues, as outlined by Adams in a recent interview. Firstly, the SEC questions whether Uniswap's interfaces classify it as a broker. Adams draws parallels to other platforms like Coinbase, emphasizing similarities in interface design and highlighting a recent court ruling in favor of Coinbase. He remains optimistic that Uniswap ( CRYPTOCAP:UNI ) will similarly triumph in this aspect of the case.
Secondly, the SEC has raised concerns about the classification of UNI tokens as securities. Adams underscores Uniswap's adherence to regulatory guidelines and transparency in operations, particularly highlighting the free distribution of UNI tokens to the community. He firmly asserts that UNI tokens do not meet the criteria for securities, expressing confidence in Uniswap's compliance with existing regulations.
The third issue centers around whether the Uniswap protocol operates as an unregistered securities exchange. Adams clarifies that Uniswap Labs does not control the protocol, which functions autonomously on the blockchain. He emphasizes that publishing open-source code to a decentralized blockchain does not equate to operating an exchange.
Beyond the immediate legal implications for Uniswap ( CRYPTOCAP:UNI ), Adams highlights the broader ramifications for the crypto industry. He draws parallels to the early days of the internet, where attempts to stifle e-commerce were prevalent. Adams underscores the transformative potential of blockchain technology and advocates for a more nuanced regulatory approach.
Moreover, Adams calls for continued advocacy for the benefits of decentralized finance (DeFi) and constructive engagement with regulators. He points to recent regulatory actions towards crypto projects, citing the challenges faced by projects like Kraken engaged in legal battles with the SEC.
As the Uniswap vs SEC saga unfolds, all eyes remain on the outcome of this high-stakes legal battle and its potential implications for the broader crypto market.

Long trade
12th April 2024
11:00am London Session
Entry: 9.1919
Profit level: 10.3029 (12.09%)
Stop level: 8.9857 (2.24%)

Alikze »» UNI | Pullback to broken structureIn the daily and weekly time, a motivational wave has taken place after the break of the dynamic trigger, which has been extended to the area of the weekly supply of this wave after the pullback.
🔰 Currently, after the failure of the area, there is a correction that this correction form can be in the green box area, after completing it, it can retest the supply area, which in case of failure can continue until the next area of the supply area.
🔰 If the green box is broken, this correction can continue up to 0.50 fibo of the previous wave, which can touch it if the next area continues.
Therefore, according to the correction structure, this form can continue up to the green box area after an upward correction.
»»»«««»»»«««»»»«««
Please support this idea with a LIKE and COMMENT if you find it useful and Click "Follow" on our profile if you'd like these trade ideas delivered straight to your email in the future.
Thanks for your continued support.
Sincerely.❤️
»»»«««»»»«««»»»«««


UNI: 8$ is Near 🧐 🧐 🧐UNI has been trading in a large bullish flag pattern on the daily timeframe. The price has been respecting the boundaries of the flag and making lower highs and higher lows. However, the price has recently failed to react to a break above local highs, indicating weakness and a possible further decline.
The bullish flag:
The bullish flag is a bullish continuation pattern that is characterized by a period of consolidation following a strong uptrend. The consolidation period typically takes the form of a pennant or flag, after which the price breaks out and continues its upward trend.
The failed breakout:
The price broke above the upper trendline of the bull flag on March 8, 2023. However, this breakout was quickly reversed, and the price fell back below the trendline. This failed breakout indicates that the bulls are not yet in control and that the price could be headed lower.
The downtrend channel:
The price has been trading in a downtrend channel since the failed breakout. The channel boundaries are defined by two parallel trendlines, one connecting lower highs and the other connecting higher lows. The price is currently approaching the lower trendline of the channel.
The support zone:
The $7-8 area is a strong support zone. This zone is defined by the horizontal levels of previous lows and the 200-day moving average. A bounce off this support zone could be expected.
The target:
The target for the bullish flag pattern is $16. This target is defined by the height of the flagpole, which is the distance from the start of the flag to the breakout point.
