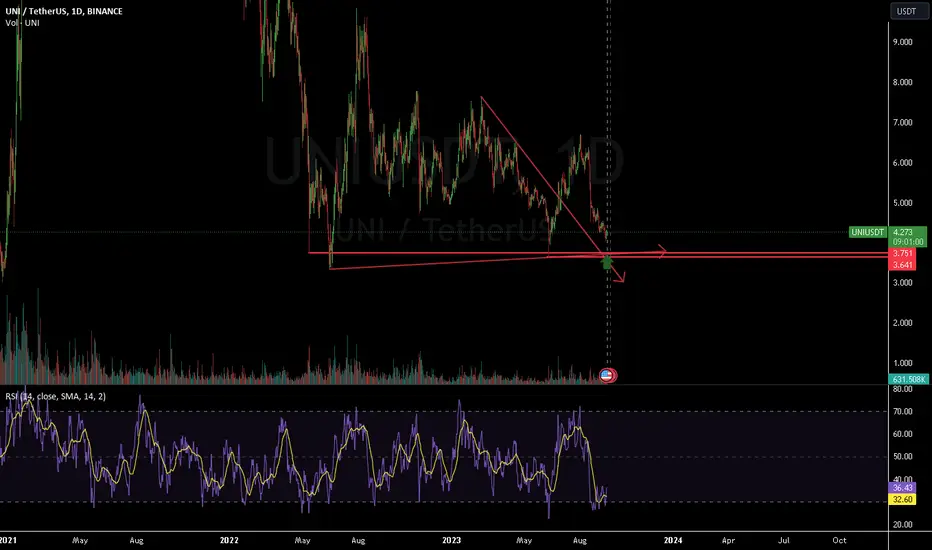
Could UNI reach 11? I know its pretty optimistic setup, but technical picture looks pretty good and UNI haven't made any major bull trend since January 2022.
These are the few signs that telling me to go up.
1. RSI made Divergence already in 1W TF.
2. Checked 4.046 area twice and able to close candle above in 1W, 1M TF.
3. Now its checking 4.046 area third time.
4. Can not close the candle below red line in 1W and 1M TF.
UNIUST trade ideas

UNI/USDT Potential 11% Drop To HappenHey traders👋
The starter of this day is going to be a UNI coin with a great rejection seen from upper zones leading price towards lower support (red zone). The Gameplay is simple here, which is waiting for that support to be broken fully which will result in a good drop on UNI coin (up to 11% of market movement) towards $3.565
If you like ideas provided by our team you can show us your support by liking and commenting.
Yours Sincerely,
Swallow Team
Disclamer:
We are not financial advisors. The content that we share on this website are for educational purposes and are our own personal opinions.

UNI SHORTi think uni ada oportunity ke above $4.. short is better
entry on $4.30
SL small risk 4.345
and take profit above $4
i hope god menyetujui nya

UNIUSD ❕ near the supportThe RSI chart indicates that the initiative is shifting to the buyers.
The price broke above the 50EMA at 30m TF.
I think that UNI will bounce if it holds the support level.

UNIUSDT short and long idea m15Hello competitors. What do you think about UNIUSDT ? According to the formation of divergence and price action lines, I see a downward trend of 15 minutes and then an upward trend.

UNI/USDTHI everybody , if uni gets close to 5 dollar i will sell my uni with around 11 percent gain.....
Look at this beautiful inverse head and shoulder i measured movement to predict uni target.
Gooooood Luuuuuuck

UNIUSDT short idea Hello traders. Due to the formation of a 15-minute downward trend and the formation of bos and the inability to break the resistance zone. I expect a decline

UniusdtBluechip eth ecosystem coin
Looks so good at the range low down here...
Broken downtrend looks like it might start its move back to mid range soon
Some alts moving significantly from range lows today
Others are lagging and this is one of them
42% to range high from here
Ltf its in a bull flag sitting of previous high here also
Could be setting up for a strong October.

UNI ☀️ Ahead; Slightly Bullish Trend Over 24-Hr Horizon Cloudy ☁️, slightly bearish trading conditions will linger over the global crypto market in the next 24 hours. Sunnier ☀️ slightly bullish conditions will, however, prevail over Uniswap, Cardano, and Chainlink, according to ATTMO’s forecasts.
Over a one-week horizon, a mixed picture arises. The sun ☀️ will return and shine over Bitcoin, Litecoin, Cardano, and Uniswap. Other altcoins including Ether, XRP, and Binance face bearish clouds ☁️ and downside risks. Avalanche may even face stormy ⛈️ trading conditions, signaling the risk of a very bearish trend.
Follow us for more crypto weather reports!

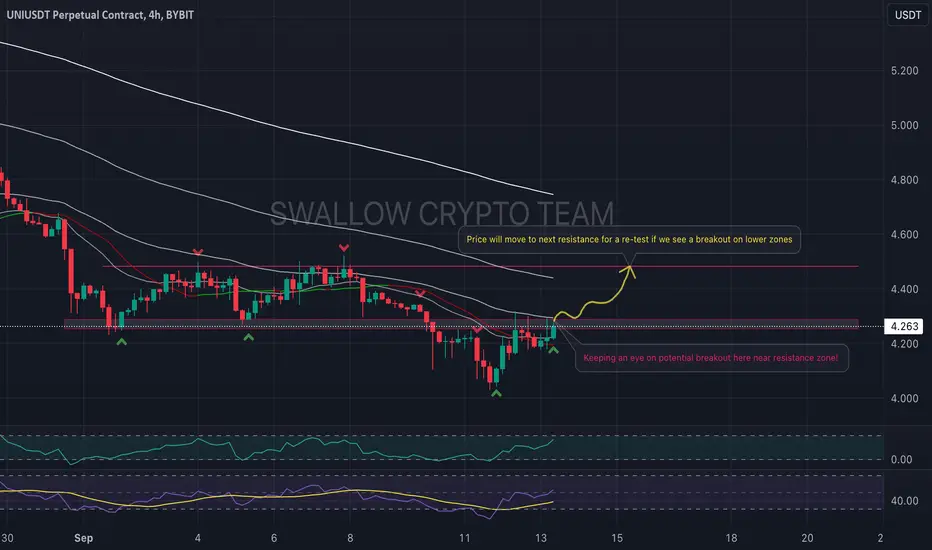
UNI/USDT Approached the ResistanceHey traders👋
Another day starts here and this time we are starting with UNI coin. After showing some bullish moves from this coin we have finally approached that upper resistance zone where price is sitting at right now!
Major decision on ether coin will breakout or show some weakness should be clear today! So keep your eyes opened for potential breakout or re-test to lower zones!
If you like ideas provided by our team you can show us your support by liking and commenting.
Yours Sincerely,
Swallow Team
Disclamer:
We are not financial advisors. The content that we share on this website are for educational purposes and are our own personal opinions.

UNI/USDT Potential Breakout .... or Fakeout? Hey traders👋
We are looking at UNI coin where we see a price pushing towards 100EMA zone with a hope to breakout from resistance zone which is currently holding the price back. If the breakout from this zone will be successful then there is a chance of further bullish movement!
If you like ideas provided by our team you can show us your support by liking and commenting.
Yours Sincerely,
Swallow Team
Disclamer:
We are not financial advisors. The content that we share on this website are for educational purposes and are our own personal opinions.
Big Technical Alert on Uniswap (UNI)These technical data points can be extremely powerful
Its not a holy alert and can change in time too as the current monthly candle has not yet closed. That said the current data offers an interesting bit of potential and very worthy of getting a technical alert on.
When price is able to recover and reverse then the follow thru can be fast
Failed moves fail fast. This can be seen time and time again. Of course it too isnt holy but is a very powerful bit of technical data to look out for. As price recovers and the trend swings then people seem like they want to rush in and catch the changing tide.
Is this happening right now with UNI?
I cannot be sure Im still searching for that damn crystal ball. We interested understand that there can be a big move incoming and keeping an eye out for interesting opportunities that offer low risk can be part of the why were interested.
Keep an eye on how it develops
Could be a different set of circumstances tomorrow.. be like water to the changes in the flow (of data)


UNI SWING SIGNAL WITH TERIGER LONGHello again dear traders
UNI currency is located on a pivot support zone in high timeframes such as daily
Also, a decrease in sales momentum can be seen in the 12-hour time frame with an upward divergence
You can enter long trades with your own trading style with the entry trigger.
Thank you for your support
I would be happy if you could comment your opinion.

#UNI/USDT rejecting from the Diagonal Trendline in 4-Hour TF!#UNI/USDT rejecting from the Diagonal Trendline in 4-Hour TF!
BME:UNI needs to clear PDH to gain bullish momentum. Wait for Breakout to open long. PWL $4.1 is acting as a strong support.

UNI/USDTHi .... watch my beautiful analysis on uni/usdt :https://www.tradingview.com/chart/UNIUSDT/bSSBxt3y-UNI-USDT/
.....you should collect your alts by dollar cost averaging method and sell it after big pop .....i am still on my last saying buy uni in these zones ....
GOOOOOOD LUUUUUUUUCK
UNI longUNI bounced off the support level. Asset broke trough off the descending trendline. Bullish movement to resistance level at 4.51 is possible.

UNIUSDTNot an investment recommendation. This chart was made for personal study and personal use only. If you like the idea, please boost it. If not, write why. In my humble opinion, the price will go up.

UNI Sell Trade Here is My Study on UNI
Consider All Take Profit Zone are Important.
Welcome to my channel! Here you'll find daily technical analysis ofthe latest trends in the crypto market. From Bitcoin to altcoins, I'lIl be sharing my insights and predictions to help you make informed decisions
about your investments. Follow me for the latest updates and join the conversation in the comments!
Crypto technical analysis uses past price history to predict future price. It's not a guarantee and shouldn't be relied on solely for investment decisions. Consider other factors such as market trends, economic strength and
information dissemination. Use with caution.
This Is Not A Financial Advise

UNIUSDT ShortThe fact that this pair will not recover, I assume that it will continue with the bearish momentum.

#UNI/USDT 4h Bullish Ascending TriangleHello everyone!
Currently, there is accumulation within the bullish ascending triangle. We have formed EQHs that we will be removing later on.
Expecting a correction in the Fibonacci range of 0.705 - 0.79 for a touch of the trendline and a move towards Fibonacci 1.618.
Best wishes!

Anticipating Corrections and Support LevelsFollowing the initial resistance encountered around the $6.5 mark and the subsequent breach of the upward trend, UNI exhibited a subsequent unfavorable response during its second attempt at testing the resistance level. This outcome aligns precisely with our previous projection of an adverse response and a substantial corrective phase. As a result, the value of the currency is anticipated to continue declining until it approaches the vicinity of $4. The confluence of price correction and selling pressure within the market contributed to a significant downturn in the currency's value.
As of now, there has been no observable optimistic rebound in response to the $4 support level. However, if such a rebound materializes, it may lead to a favorable price fluctuation in the currency. In the immediate term, a trial of the $4.55 resistance level could potentially trigger a negative response, potentially causing the price to descend to the $4 support level. It's noteworthy that UNI's lower support levels are situated around the $3.50 range.

Brief Analysis——UNIAlthough BTC led most tokens to usher in a pump, the next day red candle covered the gains of most tokens. Today's brief analysis will continue the review of previously analyzed tokens. What we chose today is UNI and 1inch.
We conducted a brief analysis of UNI in mid-July. It is believed that the high probability of the rise has not ended. As we thought, the price rose and broke the given resistance level. And after the bears strengthened, it returned below the given resistance level. The long red candle on Aug. 2 means that the bears was starting to attack. After that, UNI fell, broke through the given support level downwards, and came to near the lower rail of the gray range.
This week, the bulls started to strengthen and the price rebounded. However, whether it is from the trading volume or the length of the green candle, it can be seen that the power of the bulls is still very weak. It is just a normal rebound after the bears decay. On Tuesday, UNI formed a long green candle due to market-driven effects. One day later, long red candle covered the gains brought by the pump.
Conclusion: The high probability decline has not ended. UNI remains neutral on a large scale. The bears are stronger than the bulls, who barely gain strength after the price approaches the green dotted line. So we come to this conclusion. We set new resistance level at 5 and support level at 4.
Disclaimer: Nothing in the script constitutes investment advice. The script objectively expounded the market situation and should not be construed as an offer to sell or an invitation to buy any cryptocurrencies.
Any decisions made based on the information contained in the script are your sole responsibility. Any investments made or to be made shall be with your independent analyses based on your financial situation and objectives.
