#UNI/USDT unable to hold the Diagonal Trendline as a support in #UNI/USDT unable to hold the Diagonal Trendline as a support in 1-Hour TF!
BME:UNI can retest PDL or PWL too. Expecting some bearish momentum.
UNIUST trade ideas

#UNI/USDT 4h Bullish Descending WedgeHello, everyone!
We have a descending wedge pattern in front of us, which traditionally resolves to the upside. Currently, there has been a bounce off the Alligator's jaw, indicating a likelihood of a second touch on the wedge's support with a fresh test of the lows.
After this retest, there is potential for a breakout from the wedge by capturing a pool of trend liquidity from above.
Good luck with your trades!

$UNI waiting for corn to dip a little and this should deviate below then reclaim is the trigger
flipped coinbase for volume so thought its time price started reflecting that

Uni Trading PlanHorizontal supp/resis yellow lines
RSI support and resistance lines on the weekly
long and short scenario
likely activation with in 10 weeks

UNI/USDT We want to see further drop but before that.....Hey brother and sisters 👋
UNI coin caught our attention here with a nice potential for small bullish movement here! We see that EMAs are left behind and RSI has already shown us some nice recovery!
We are waiting for price to be a little bullish here before further drop!
If you like ideas provided by our team you can show us your support by liking and commenting.
Yours Sincerely,
Swallow Team
Disclamer:
We are not financial advisors. The content that we share on this website are for educational purposes and are our own personal opinions.

UNI goes downIt seems that we will have a fall to the specified support level by meeting the downward trend line.

UNIUSDT OUTLOOKUNIUSDT lookslike making HnS pattern
GoodLuck guys !
invalid if price break green line
DYOR

UNIHi,look at my last analysis on uni :https://www.tradingview.com/chart/UNIUSDT/bSSBxt3y-UNI-USDT/
now here it is .....you can nibble some uni and put in your pocket ......(go long )
Good luck

UNI/USDT Hey traders 👋
UNI coin is starter of the day today with a nice potential for a breakdown to happen soon here. We see that candle movement here getting slowly surpassed by bears where after some nice bullish movement price has some struggles to continue the same movement here.
We are looking for a conformational breakdown from EMAs which will lead the price to have bigger drop! The key here is wait and just wait....
Waiting and keeping eyes opened!
Have a great start of the day
Swallow Team
P.S - If you like ideas provided by our team you can show us your support by liking and commenting.

UNI/USDT Sharp Trend = Sharp FallHey traders 👋
Let's kick off this day with UNI coin where we see a nice potential for a breakdown to happen soon. We see that price has been going for that bullish trend here but at the same time it has many struggles to reach that upper side of that trend meaning the volume is getting weaker and weaker.
Now we are waiting for that momentum for price show some more weakness and break down from lines of EMAs
If you like ideas provided by our team you can show us your support by liking and commenting.
Yours Sincerely,
Swallow Team
Disclamer:
We are not financial advisors. The content that we share on this website are for educational purposes and are our own personal opinions.

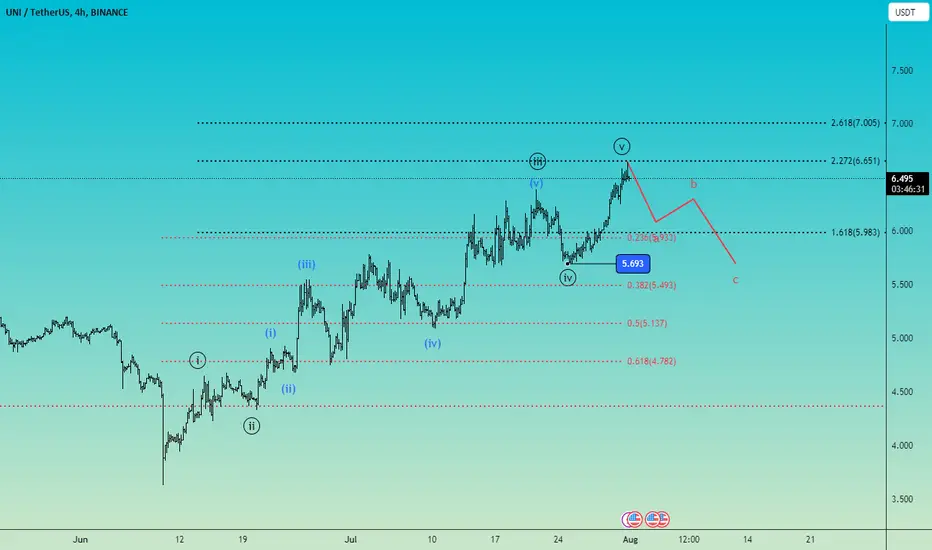
Uniswap intraday 4H, Elliott wave countAfter 5 waves to the upside expecting a correction for wave 2 that may keep the prior 4th wave pivot and than to continue up with a 3rd wave.
Future updates will be posted as updates to this count.
Daily intraday updates on 1H and 4H time frame, don`t miss them!!
Good luck!
UNI/USDTHi, guys wait to get uni on best potential prices.....manage your position size ,,,consider please altcoins have hefty volatility......but in terms of me,i will be buyer there.
Good luck

UNIUSDTThe conditions of the BINANCE:UNIUSDT are as follows:
Over the past 50 days, we have witnessed an uninterrupted 85% price growth.
Most of the resistance lines we assumed for UNI turned out to be weak, and the price easily surpassed them.
However, now we are approaching the 0.786 Fibonacci retracement level, which is located at a price of $6.75. In my opinion, this point, or $7, could potentially lead the price back to $6, and then $5.30.
At the $6 price point, we have strong support. However, between $5.80 and $5.35, there is a fear value gap(FVG), which could guide the price to those points and cause a price drop.
Also, in the 4-hour timeframe, we are witnessing a divergence in the RSI (Relative Strength Index) indicator, which can be an initial signal of a trend reversal.
But we need to wait and see how the market reacts to the $6.75 price level.
Ultimately, everything depends on the overall market conditions.

Uniswap Trend line and support and resistance Uniswap forming a Trend line in 1hr timeframe , as you can see in chart ,when the price is touches the trendline it bouncing back.
. support and resistance are given in chart , please look forward to it.
.
.DYOR

UNIUSDTUniSwap is in a good position to sell, the first target is -6%, the second target is -14%.
good luck

Keep eye on UNIUSDTUniusdt taking support on a trendline as you can see on a chart and also forming a pennant pattern let's see which side it will break.
.
.
.DYOR

UNIUSDTAccording to chart after two unsuccessful times for breaking up the broken support its time to take action on short position.
I'm bearish at the moment.

$UNI Updated Idea / Different POVUpdated BME:UNI short idea from earlier.
Set the Monday Range -- High, Low, Mid.
Monday's High got taken out, if we break below the mid I expect Monday's Low to get taken out next.
Shaved a little off from my entry at $5.35 & moved stops to breakeven.
Invalidation = Clean break above $5.38.

From Support to Surge: A Look at #UNIUSDT's Ascending Channel💎 Paradisers, the mid-term price action for #UNIUDT remains optimistic, as we continue to observe a pattern of higher highs and higher lows. What's more, #UNI has recently retested and rejected the vital demand zone near $5.7 for the third time in a row. It's evident that the bulls are holding their ground, and this could lead to a powerful surge shortly.
💎 We must also consider the bounce off the 50% Fibonacci retracement level, intriguingly situated right in the supply/demand area. Furthermore, #UNI continues to trade above the 200 Simple Moving Average on the 4H timeframe, once again displaying its bullish intentions.
💎 In terms of immediate resistance, the peak of the ascending channel could be the first area for profit-taking. However, if the price breaks above the channel with robust buying pressure, we could witness a much more potent trend in the upcoming weeks.
💎 Of course, this bullish outlook would be negated if the bulls fail to defend the demand zone, but as of now, #UNI appears quite bullish. Stay tuned for more updates and happy trading, Ladies and Gentlemen of ParadiseClub!

UNI Spot TradeLooking to buy some UNI if we get a pullback. Looks like it's primed for a push to the top of a large accumulation zone.


UNIUSDTHello Trader
UNIUSDT
the potential for this pair to rise wedge or experience a drop in price
because of the potential to short the desired area 5.7-5.8
Please add a comment and Positive feedback and
constructive criticism are important to authors and the
community.

UNIUSDT: Head & Shoulder PatternUNIUSDT is showing Bearish Divergence, followed by a Head & Shoulder pattern, which strengthens the indication of a potential trend reversal from bullish to bearish.
