$UNI/#USDT [#Uniswap]: Resistance_Breakout◳◱ A Resistance Breakout has been identified on the $UNI / $USDT chart. The price has broken above a key resistance level, indicating a potential bullish trend. The next resistance key levels are located at 6.827 | 7.304 | 8.189, and the major support zones can be found at 5.942 | 5.534 | 4.649. Consider entering at the current price zone of 5.585 and targeting higher levels.
◰◲ General info :
▣ Name: Uniswap
▣ Rank: 19
▣ Exhanges: Binance, Kucoin, Bybit, Gateio
▣ Category/Sector: Financial - Decentralized Exchanges
▣ Overview: Uniswap is a decentralized exchange built on Ethereum that utilizes an automated market making system rather than a traditional order-book. Instead of matching individual buy and sell orders, users can pool together two assets that are then traded against, with the price determined based on the ratio between the two.
◰◲ Technical Metrics :
▣ Mrkt Price: 5.585 ₮
▣ 24HVol: 8,194,285.430 ₮
▣ 24H Chng: 3.753%
▣ 7-Days Chng: -11.76%
▣ 1-Month Chng: -11.99%
▣ 3-Months Chng: -5.50%
◲◰ Pivot Points - Levels :
◥ Resistance: 6.827 | 7.304 | 8.189
◢ Support: 5.942 | 5.534 | 4.649
◱◳ Indicators recommendation :
▣ Oscillators: NEUTRAL
▣ Moving Averages: BUY
◰◲ Technical Indicators Summary : BUY
◲◰ Sharpe Ratios :
▣ Last 30D: -2.21
▣ Last 90D: -0.23
▣ Last 1-Y: -0.05
▣ Last 3-Y: 0.99
◲◰ Volatility :
▣ Last 30D: 0.68
▣ Last 90D: 0.66
▣ Last 1-Y: 1.02
▣ Last 3-Y: 1.65
◳◰ Market Sentiment Index :
▣ News sentiment score is 0.77 - V. Bullish
▣ Twitter sentiment score is 0.50 - Bearish
▣ Reddit sentiment score is 0.32 - Bearish
▣ In-depth UNIUSDT technical analysis on Tradingview TA page
▣ What do you think of this analysis? Share your insights and let's discuss in the comments below. Your like, follow and support would be greatly appreciated!
◲ Disclaimer
Please note that the information and publications provided are for informational purposes only and should not be construed as financial, investment, trading, or any other type of advice or recommendation. We encourage you to conduct your own research and consult with a qualified professional before making any financial decisions. The use of the information provided is solely at your own risk.
▣ Welcome to the home of charting big: TradingView
Benefit from a ton of financial analysis features, instruments and data. Have a look around, and if you do choose to go with an upgraded plan, you'll get up to $30.
Discover it here - affiliate link -
UNIUST trade ideas


UNI Uniswap Labs’ mobile crypto wallet blocked by AppleUNI Uniswap Labs, the firm responsible for the foremost Ethereum-based decentralized exchange (DEX), is purportedly encountering hindrances in its attempts to release a mobile cryptocurrency wallet for iPhone users.
As per a spokesperson from Uniswap Labs, despite fulfilling all of Apple's requirements, the company has not granted approval.
This recent obstacle reinforces the notion that Apple is a rigid overseer of crypto enterprises' admittance to the iOS platform, and its prohibition of cryptocurrency trading applications that do not employ "an authorized exchange" has faced criticism.
Considering also the Double TOP chart Pattern, I now expect a retracement to the next support of $4.95.
Looking forward to read your opinion about it.

UNI/USDT Time For Correction Or Not?Good morning guys ✌️
Let's kick off this day with UNI/USDT pair. After that amazing drop price has reached another support zone where ideally we would wait for smaller correction to happen. EMA zones are way too far from market price. There is also a chance that price will have further drop without any correction so look closely for any action to be taken here!!
If you like ideas provided by our team you can show us your support by liking and commenting.
Yours Sincerely,
Swallow Team 🔱
Disclamer:
We are not financial advisors. The content that we share on this website are for educational purposes and are our own personal opinions.

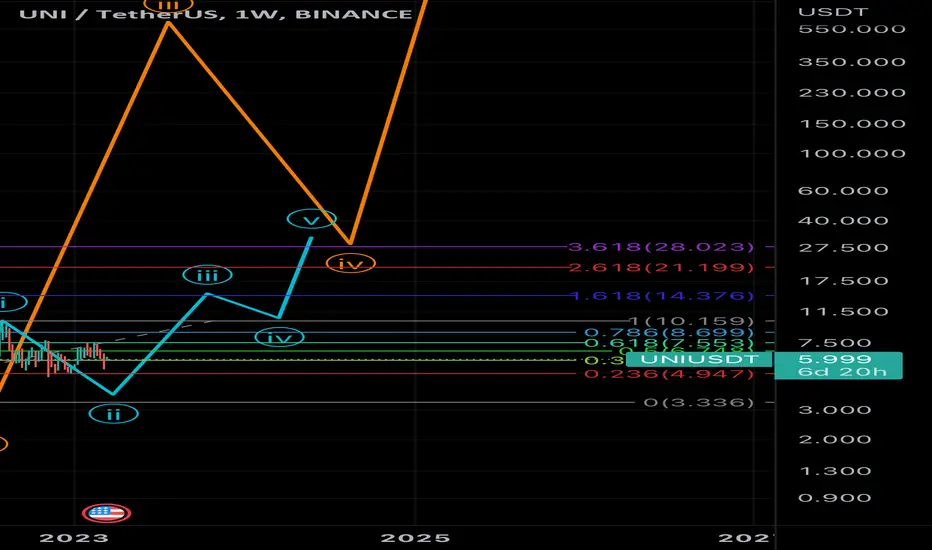
UNIUSDT Elliott Waves AnalysisHello friends.
Please support my work by clicking the LIKE button👍(If you liked). Also i will appreciate for ur activity. Thank you!
Everything on the chart.(update)
Nothing has changed from my last idea, still waiting for upward movement.
Targets: 7.5 - 10 - 12
Main Target zone: 12 - 15$
after first target reached move ur stop to breakeven
Stop: agreesive 4.8, conservative 3.4 (depending of ur risk). ALWAYS follow ur RM .
Risk/Reward: 1 to 10
risk is justified
Good luck everyone!
Follow me on TRADINGView, if you don't want to miss my next analysis or signals.
It's not financial advice.
Dont Forget, always make your own research before to trade my ideas!
Open to any questions and suggestions.

UNIIdea: The price fell to a key support level. A falling wedge is being formed. The price will fall to the $5.6 support level if it breaks the current support level

✴️ Uniswap vs Tether (Think Long-Term For Success)I have to admit that this is basically the same chart as the BTC pair, UNIBTC.
We are looking at Uniswap vs Tether, UNIUSDT.
This pair hit bottom in June 2022 with the week closing in a Doji with the highest buy volume ever at the time, then an even bigger volume session/week in August... This is how the market seals the bottom, very strong buying right after the low is hit.
A famous investor and trader says that the financial markets are a mechanism to transfer wealth from the impatient to the patient.
I tend to agree.
When trading spot, just buying Altcoins, any mistake can be corrected through a long-term wait.
If you buy a pair expecting a rise and it doesn't happen, waiting can fix any and all mistakes... But if one is impatient, a loss can be sealed by selling lower than the entry point.
And the worst experience of all, right after you sell at a loss, prices start to grow.
UNIUSDT as its counterpart UNIBTC has been undergoing consolidation for many months after the initial breakout in June 2022.
A higher low was hit in November 2022 compared to June.
And since the July peak we have over 7 months of consolidation...
Think of this, or better yet, look at past history from May 2021 to June 2022.
The bearish trend is quite easy to spot.
The bear market is quite easy to read, lower highs and lower lows.
We have no new lows in almost 9 months... This is the accumulation phase, when whales, smart people, experienced traders and institutions load up on their favorite coins.
Once the accumulation phase is over, the next cycle starts to form.
The give away is the high buying volume after the June 2022 low and the fact that we have no new lows after 9 months when in the past a new low would be hit every few weeks.
We also have an ABC correction, if you saw my Bitcoin Elliot Wave Theory trade idea, you know what follows next.
It is a system to transfer wealth from the impatient to the patient, knowing this... What will you do?
Buy and hold or jump from pair to pair?
My money is on the hold... I am thinking long-term.
Think long-term. 1-2 years into the future.
Namaste.
P.S. When the next bull-run comes we will see new All-Time Highs all across, the amount of growth that we will experience, the numbers, will be much more than anything anybody can imagine at this point.

UNI Go DownThe UNI tool has formed a cascade of two local support levels, behind each of which I expect to see the participants' stops and, due to them, an impulse breakdown. The formation of a descending triangle with a decrease in hays also indicates the strength of sellers in this situation.


UNI in its predicted bottomAs we can perceive, Uni have reach its bottom line with a Marubozu candlestick, let's see what comes first.

UNIAgain this is already started to show clear bullish sign guys grab this opportunity target should be between 11-13

Unisusdt March better month for traders or?
This ones been coiling at resistance for like a month now
Should break accumulation sooner or late if it breaks decentralised perpetual protocols should also do very well
Gmx dydx perp and inj are the ones I’m watching
In that order
Dydx has the highest volume and gmx hast the smartest staking mechanism with fees payed out in eth to stakers
Both should outperform from here to 2024

UNI USDT breakout is coming
Max lev 10X.
BUY UNIUSDT
Entry range: 6.550 to 6.445
Stoploss: 6.100
Targets: 6.810 , 7.000 7.300 and last 7.660

UNI USDT Bullish Trend start in 1 HR TFBINANCE:UNIUSDT Bullish trend start in UNI USDT in 1 Hr TF. Bullish Hammer is showing in the chart UNi break the Previous Lower high and now move upword break the another Lower high.

$UNIUSDT: Uniswap trend reversal spotted Looks like Uniswap finally triggered a bullish trend signal here. I think it's likely a good position to have, specially considering the recent regulatory noise.
Best of luck!
Cheers,
Ivan Labrie.

#Uniswap inside a Rising Wedge, Support At $6.2Past Performance of Uniswap
Uniswap prices are within a rising wedge, consolidating, as visible in the daily chart. The uptrend is valid despite bears having the upper hand in the past few days. Still, traders should watch out for how prices perform. If UNI drops below $6.2, there could be more short- and medium-term losses. Conversely, gains above $7.4 and the expanding wedge may pump Uniswap bulls.
#Uniswap Technical Analysis
UNI is trending, consolidating within an expanding wedge. Overall, sellers appear to be resisting attempts higher. However, with UNI consolidating horizontally, soaking selling pressure, buyers stand a chance. In the days ahead, the primary support lies at $6.2, while resistance is $7.4. Conservative traders can wait for a breakout, aware that losses below $6.2 may see UNI retest at $5. Conversely, any surge above the $7.4 to $7.6 resistance zone may trigger demand, lifting the token to August 2022 high of around $9.6.
What to Expect from #UNI?
Presently, UNI prices are consolidating inside the expanding and rising wedge. There are clear resistance and support levels. However, since there appears to be accumulation, the best course of action is to wait for a high volume break out in either direction before riding the emerging trend.
Resistance level to watch out for: $7.4
Support level to watch out for: $6.2
Disclaimer: Opinions expressed are not investment advice. Do your research.

UNI, comfirms BTC'S lateralityUNI is helpting us detecting a short laterality before hitting another Fibo Support.
If you go Long you might get a 3% not so recommendable, just as a test set up.

UNI/USDT waiting for upper zoneHey, guys ✌️
Another one we would like to talk about is going to be UNI coin. Currently trading inside the sideways movement we see a good chance for this coin to go for another re-test of upper zone. We will be watching closely this one as we might as well go for those EMA zones and break them.
If you like ideas provided by our team you can show us your support by liking and commenting.
Yours Sincerely,
Swallow Team 🔱
Disclamer:
We are not financial advisors. The content that we share on this website are for educational purposes and are our own personal opinions.

UNIUSDT - Long with low Lev 3X or 5XUNIUSDT - Long with low Lev 3X or 5X. Good to buy in SPOT as well without SL

UniSwap's waterfallFibonacci's ratios show a constant decrease in the trend as bearish scenario.
We might get another 10% deeper if BTC decreases drastically.
1H candlesticks show more aggresivenes than in 4H, but still it is in the
Fib's ratio.

UNIUSDT | UPSIDE POTENTIALUNIUSDT was trading in a bearish trend .
The price was trading under the long downtrend line.
Now the price has finally broken above the downtrend line.
Th price has also broken above the horizontal resistance.
The bulls are i control.
Manage your trades accordingly.

The bottom of the ascending channel has yet to be brokenOver the past week, UNI has continued its price growth within an ascending channel and has shown a strong negative reaction by hitting an important resistance in the $7.62-$8.
The bottom of the ascending channel has yet to be broken, and due to the solid retracement for this dynamic support, the possibility of breaking this range has increased.
More power is still in the hands of buyers. But if the bottom of the channel is broken, the first valid support is $6.56 to $6.67, and the second support is $5.95 to $6.11. The weekly timeframe candles show that as long as the second support holds, there is potential for another strong up move.
The closest near-term support to the current price is $7-$6.96, which exactly overlaps with the bottom of the long-term ascending channel. So the continuation of the price trend depends on how to react to this range.
