UNI. Movement.You can call it sideways movement or a movement in a global ascending channel - imo, both options will be valid for BME:UNI you can expect 60% up move - to the middle of the channel
UNIUST trade ideas

Buy Trade Strategy for UNI: Tapping into DEX Leadership and DeFiDescription
This trading idea is based on UNI, the governance token of Uniswap, one of the largest and most influential decentralized exchanges (DEXs) in the crypto space. Uniswap has revolutionized trading by allowing permissionless token swaps, liquidity provision, and yield opportunities—all without intermediaries. UNI holders can participate in the governance of the protocol, influencing key decisions that shape the future of the platform. With consistent growth in user activity, volume, and DeFi adoption, UNI stands out as a strong candidate for long-term value appreciation within the decentralized finance ecosystem.
That said, it’s important to be aware of the risks. The cryptocurrency market remains highly volatile and subject to various external pressures including regulatory shifts, competitive innovations, and macroeconomic events. These factors can significantly influence the performance of assets like UNI.
Disclaimer:
This trading idea is for educational purposes only and does not constitute financial advice. Trading and investing in cryptocurrencies, including UNI, involve substantial risk and the possibility of total capital loss. Always conduct your own research, evaluate your risk tolerance, and consider consulting with a financial advisor before making investment decisions. Past performance is not a reliable indicator of future results.

#UNI DAILY TIMEFRAME UPDATE ❤️ THIS POST AND I WILL SHARE NEXT PAIR
Uniswap is a popular decentralized trading protocol, known for its role in facilitating automated trading of decentralized finance (DeFi) tokens.
ANY THOUGHTS ON BME:UNI

UNIUSDT: A Massive Bullish Move Loading… or a Trap?Yello, Paradisers! Is UNIUSDT finally gearing up for a major breakout, or is this just another fake move before a deeper correction? Let’s break it down.
💎UNIUSDT is currently trading within a descending channel, increasing the probability of an upcoming bullish move. The key support zone is holding strong, and we might be witnessing the early signs of a double-bottom formation—a classic reversal pattern.
💎However, confirmation is everything in trading. To increase the probability in our favor, we need to see: Bullish divergence, Bullish I-CHoCH (Internal Change of Character), Bullish reversal patterns such as a W-pattern or inverse head and shoulders from our support zone.
💎If UNIUSDT retraces further, we expect a bounce from the strong support zone—but again, we must wait for clear bullish confirmations before taking any positions.
💎The invalidation level? If price breaks and closes candle below the strong support zone, the entire bullish setup gets invalidated. In that case, we wait patiently for better price action before considering any new trades.
🎖Patience and discipline are key, Paradisers. Many traders will get trapped in bad positions, but those who wait for the right confirmations will be the ones making money. Trade smart & stick to high-probability setups only.
MyCryptoParadise
iFeel the success🌴

UNIUSDT LONGUNIUSDT LONG SWING TRADE
📥 Entry $6.0 - $6.5
🎯TP1: $8
🎯TP2: $10
🎯TP3: $12
🎯TP4: $13.5
🎯TP5: $16+
This is a buy and hodl trade. #dyor

UNI – Symmetrical Triangle Breakout in Play on 4H Chart🟢 UNI is breaking out of a symmetrical triangle on the 4H timeframe — a classic setup that often precedes momentum moves.
🔁 A clean retest and hold above the breakout zone could confirm strength and ignite the next leg upward.
⚠️ However, failure to hold might lead to a quick fakeout and re-entry into the range.
👀 Price action is crucial here — this zone could decide the short-term direction.

Uniswap (UNI): Clean Breakdown + Successful Re-TestUniswap has had a nice breakdown recently where price retested the broken zones and had a sharp rejection. Sellers are showing their dominance and we are seeing a good chance of downward movement to follow up here.
As long as sellers hold control over $5.35 (the retest zone), we should be good for short here.
Swallow Academy

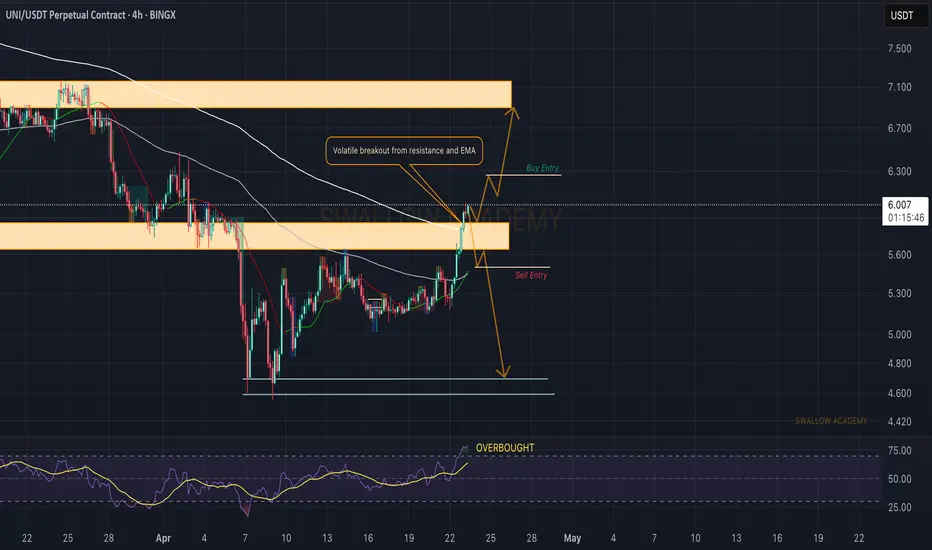
Uniswap (UNI): Breakout From Resistance & 200EMA | Re-Test?Uniswap had a strong breakout from the resistance zone, which is aligned with the 200EMA line. Now we had a breakout, which also led the RSI into the overbought area but what we did not see is any kind of retest of those broken zones so this is what we are looking for at first.
From there, depending on whom the dominance at that zone will fall to, according to that, we are going to look for either a long position or a short.
Swallow Academy
Uniswap (UNI): 3 Possible Trades That Can Make Us Some ProfitUniswap coin made some great moves lately, where we reached our target and also saw a breakdown of the local support zone, which now is acting as a resistance zone. We caught here 3 possible trades, where the one we most want to see is the short position on the hourly timeframe.
More in-depth info is in the video—enjoy!
Swallow Academy

UNI – Long Spot Trade Setup Following Breakout and RetestUniswap (UNI) has recently broken out of resistance and successfully retested it as support, forming a strong bullish structure. If Ethereum (ETH) continues upward, UNI is likely to benefit from correlated momentum, potentially kicking off a larger rally.
🔹 Entry Zone:
$5.46 – $5.95 (post-breakout retest zone)
🎯 Take Profit Targets:
🥇 $7.50 – $8.00
🥈 $10.00 – $10.50
🛑 Stop Loss:
$4.10

#UNIUSDT The end of the chart can be considered a
bullish invered head and shoulders pattern that
has not yet completed the right shoulder.
By crossing the red resistance line and hitting the upper red resistance band,
it can complete the right shoulder and
by crossing the red resistance band firmly and steadily, it can surge and make a good profit.

Should You Invest in Uniswap $UNI Crypto Right Now?Grab your popcorn, or whatever you vibe with—because today I will analyze Uniswap. Yep, the decentralized trading protocol that lets you swap tokens like Pokémon cards, but without asking mom for permission.
So, what is Uniswap? Simple. It’s like the vending machine of the crypto world. Wanna swap your Ethereum CRYPTOCAP:ETH for some Shiba Inu? Go ahead. No sign-up. It’s peer-to-peer, decentralized.
Remember those juicy monthly demand levels at $3.868 and $4.750 we discussed at the Set and Forget Trading Community? Yeah, those weren't just random numbers pulled from a bingo machine. That’s where big buyers stepped in, creating a supply and demand imbalances. Translation: There were way more people wanting to buy than sell, which made the price go UP. Magic? No. Just basic market dynamics, people.
And guess what? Those levels played out beautifully. Buyers showed up, price popped, and if you were patient, you got paid. If you weren’t… well, you can enjoy your bag of regrets.
Now, here’s where it gets interesting. The daily timeframe is now trending UP. We’ve officially seen the creation of a fresh imbalance at $5.19. That’s our new price level for buying Uniswap. But are we buying right now? NOPE.
Because here’s the golden rule of trading and investing: Patience is key. I know, I know—it’s boring. Waiting feels like watching paint dry… but on the blockchain. But trust me, the market doesn’t care about your feelings or my feelings.
We're waiting for price to pull back into $5.19, where the last big buyers left a footprint the size of a crypto whale. When will it get there? We don't know. THEN we’ll look to repurchase. Not before.
So remember—Uniswap is a beast in the DeFi world. Supply and demand is your best friend. And above all, don’t chase the pump. Let it come to you. Like a well-trained dog… or a well-behaved altcoin.


UNI | Long | Spot Demand + DEX Strength | (May 21, 2025)UNI | Long | Spot Demand + DEX Strength | (May 21, 2025)
1️⃣ Quick Summary:
Uniswap caught my attention with strong buying activity on the spot market. The price is reacting to demand, and it aligns technically with a potential breakout area. This could be a great compound trade opportunity if momentum continues.
2️⃣ Trade Parameters:
Bias: Long
Entry Zone: Current levels showing buy interest—watch closely for confirmation
Stop Loss: $3.59 (unlikely to hit unless invalidated)
TP1: $5.67
TP2: $12.30
Final TP: $30.86 (long-term macro target if market structure flips bullish)
3️⃣ Key Notes:
✅ Spot market interest suggests real demand—watching for continuation.
✅ UNI is a leading DEX token, and Uniswap continues to evolve with Unichain (Layer 2) on Optimism, making the platform faster and cheaper.
✅ Governance and AMM innovation give UNI long-term relevance in the DeFi space.
❌ Risk comes if BTC drags the whole market or the DeFi narrative cools—manage size accordingly.
4️⃣ Follow-Up Plan:
Looking to compound the trade if we get a strong breakout through early resistance. I’ll post an update if we break TP1 with strength.
Please LIKE 👍, FOLLOW ✅, SHARE 🙌 and COMMENT ✍ if you enjoy this idea! Also share your ideas and charts in the comments section below! This is best way to keep it relevant, support us, keep the content here free and allow the idea to reach as many people as possible.
Disclaimer: This is not a financial advise. Always conduct your own research. This content may include enhancements made using AI.

UNI pullback at support zoneBuy gradually from here or wait for breaking through this resistance line with a short-term target of at least 20%

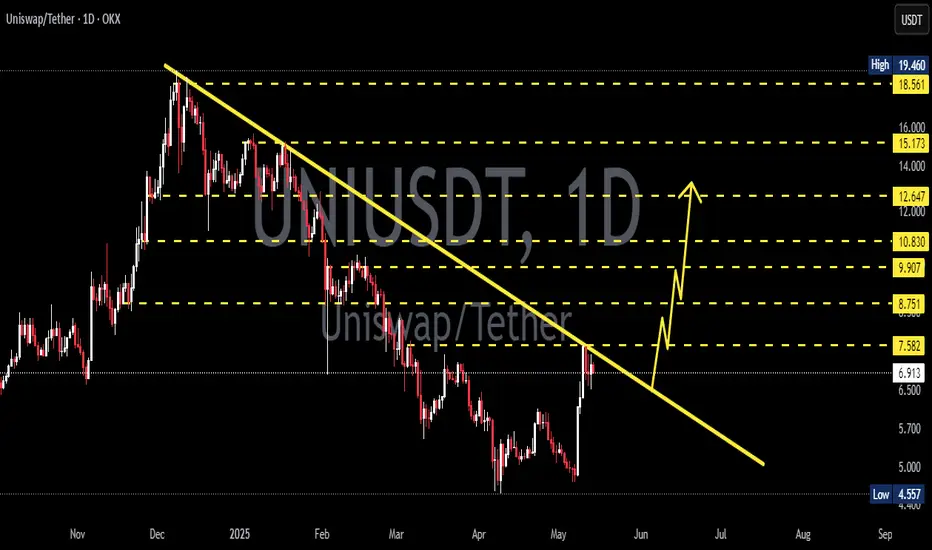
UNIUSDT 1D#UNI is currently trading within a descending channel on the daily timeframe, but it's holding above the Ichimoku cloud, which is a bullish sign. If the price successfully bounces from the Ichimoku support and breaks above the channel resistance, it could lead to a bullish rally.
Upside targets on breakout:
🎯 $8.039
🎯 $10.057
🎯 $11.689
🎯 $13.320
⚠️ Use a tight stop-loss.

UNIUSDT 1D Analysis UNI ~ 1D Analysis
#UNI Buy gradually after successfully breaking through this resistance line with a short-term target of at least 10%++
UNIUNI shows strong continuation potential after a classic liquidity sweep. As long as price holds above the retested area, the target zone remains in play.

UNIUSDT | Long Bias | Altseason Play | (May 12, 2025)UNIUSDT | Long Bias | Altseason Play + Pullback Entry Setup | (May 12, 2025)
1️⃣ Short Insight Summary:
Uniswap is showing signs of broader correlation with the altcoin season rotation. While short-term money is flowing out, the macro structure remains bullish—making this dip a potential long opportunity into the next major leg.
2️⃣ Trade Parameters:
Bias: Long
Entry Zone: $6.00–$5.69
Stop Loss: Below $5.50 (to protect against deeper breakdown)
TP1: $9.63
TP2: $17.86
Final TP: $28.44 (only for high-conviction holds or macro trend continuation)
Partial Exits: Around $9.00, $17.00, and $28.00+, with 95% of position closed before the final TP for safety
3️⃣ Key Notes:
✅ On-chain and macro altseason narrative is growing, which benefits tokens like UNI with high beta to DeFi trends.
✅ UNI still tracks closely with overall altcoin rotations, and this correction looks like a healthy pullback, not a breakdown.
✅ 30-minute order flow shows money leaving the market, aligning with the corrective dip—but creates an attractive re-entry for long-term positioning.
✅ Fundamentally, Uniswap continues evolving, and any developments around L2 integrations or governance votes could spike attention again.
❌ Be patient—don't chase. Wait for confirmation near the $6–5.69 zone before engaging.
4️⃣ Optional Follow-up Note:
This setup will be updated if the market reacts sooner or volume confirms the bounce. Will casually monitor for continuation through $9.63 and beyond.
Please LIKE 👍, FOLLOW ✅, SHARE 🙌 and COMMENT ✍ if you enjoy this idea! Also share your ideas and charts in the comments section below! This is best way to keep it relevant, support us, keep the content here free and allow the idea to reach as many people as possible.
Disclaimer: This is not financial advice. Always conduct your own research. This content may include enhancements made using AI.


Uniswap Perfect Bullish Chart With New ATH Potential Late 2025Uniswap has a chart with perfect symmetry. It is a beautiful chart, well organized, and it shows a very strong potential for a new All-Time High to be hit later this year or in early 2026.
The market bottom happened in November 2020 for UNIUSDT. This bottom low marked the start of the 2021 bull market which is clearly visible on the chart.
The bull market in 2021 produced a wave totaling 2,462% growth, that's more than 25X.
The same low/level/support that was activated in November 2020 and launched the previous bull market wave was again activated in June 2022. This low marked the 2022 bear market bottom and from this point a long-term consolidation period (sideways market) developed, with higher highs and higher lows.
There was a major low in August 2024 and the last one, April/May 2025. The current low can be equated to something similar to November 2020, from this point on, we will not see small waves as in the past three years but a major bull market. Like 2021 but much bigger. It will be huge.
A new All-Time High is not only possible but very easy for this pair, very easy...
The action will push prices beyond what is shown on this chart.
Timing is great. Prices are great. This is an easy buy and hold.
After you buy, the market will grow for months and months and months before peaking. You can't go wrong with bottom prices. The time to buy is now, when prices are low.
Namaste.

UNI Double Bottom Confirmed ?UNI push back with long green candle in support, maybe we can see double bottom here ? if yes, we can go to 5.8 or higher to 6.9

UNI / USDT - A Perfect RetestEvening fellas,
Refer to my last calls. They all worked out.
Now don't miss out on UNI cause it's gonna run within the next days. It'll be beautiful!
Trade thirsty, my friends!
