Uniswap strong momentumFirst of all, I need your support to continue my activity and provide analysis. Please support, otherwise my activity will stop.
I think UniSwap has strong potential in its volume and trading process. If you reach the red box, it is suitable for short position. Have a watch list.
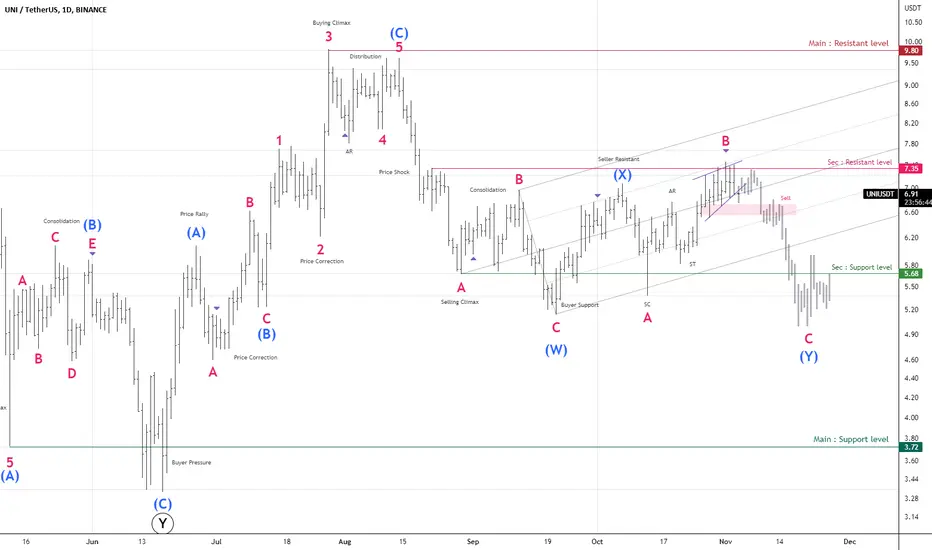
UNIUST trade ideas

UNI/usdt 1HThe unswap chart shows good signs for a 10-25% pump, but before that it has to break its neutral zone resistance ceiling.

UNISWAPHello Dear friends
Aren't decentralized exchanges more attractive?
All patterns formed in different time frames identify higher targets. Our support areas have been well maintained so far.
Provided that the orders in the area of $5.65 are not fully consumed, the possibility of continuing the upward trend to the area of $7.17 is high.
Keep in mind that this view has little validity until the bullish trend breaks above the $6.38 range.
We would be happy to hear your comments

Uniswap Bearflag: DeFi Bearish MeltdownUniswap looks to be setting up for a DeFi Meltdown that could take it down to anywhere between 30 and 1 cents as the monthly breaks this Bear Flag.

UNIIdea: The price is trying to break through a strong resistance level: POC and many MAs. The price will continue to fall to a strong support level


#Uniswap Slumps 33% in 4 Days; UNI Can Retest $3.25Past Performance of Uniswap
Uniswap can't resist the crypto gravity. This week alone, the token is down over 30 percent and trading below Q3 2022 lows, a critical support line. Per this formation, sellers can search for entries, unloading on pullbacks, targeting $3.25 in the short term. At this pace, UNI is at risk of crashing toward 2022 lows and caving to register new all-time lows altogether.
#Uniswap Technical Analysis
UNI is down 33 percent when writing and at new Q4 2022 lows, dropping below September support. In a bear breakout formation, traders can unload on every attempt higher, retesting $5.23, targeting $3.25 reading from the development in the daily chart. The breach of the multi-week support line is with high participation levels, pointing to interest. At the same time, the bar is wide-ranging, indicating volatility. This preview will change if UNI recovers above $6.10 with equally high volumes.
What to Expect from #UNI?
Behind UNI's crash are fundamental factors. Alameda Research held a significant chunk of the token and could liquidate, fanning the slump. Therefore, there is a high probability of UNI tanking to June 2022 lows unless there is intervention.
Resistance level to watch out for: $5.3
Support level to watch out for: $3.25
Disclaimer: Opinions expressed are not investment advice. Do your research.

UNIUSDTHello Dear friends
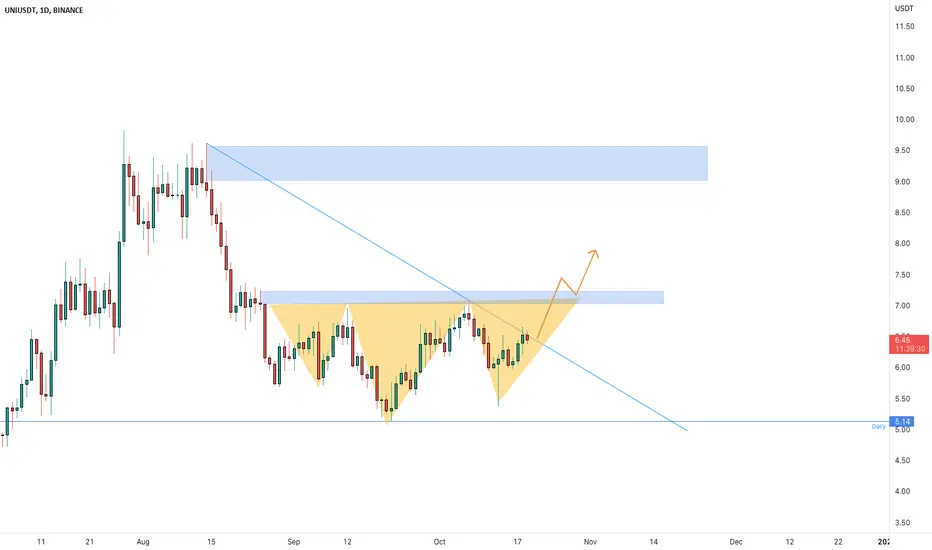
On the daily chart, according to maintaining the price range of $5, it seems that the possibility of completing the head and shoulder pattern at the end of the downward trend is high.
If the rising trend is above the range of $7.25, we expect it to advance to the yellow range ($8.88).
We would be happy to hear your comments

UNI to $1 Hi Traders,
Uni is another decent sized holding for Alameda and given the chart, looks like its heading for a complete collapse.
Good shorting opportunity.
Goodluck,
Asset Mastery

UNI Either OrLong and Short positions available on UNI. I'm trying to be conservative and set my entries where I would have set my stops

Uniswap at Critical zone Uniswap Trade in Critical level ... Uniswap show Weakness at level 7.35 Break under 6.60 May Show down Trend that target level 5.20 at least .. close above 8.20 cancel this Idea
UNIUSDT 1D Interval- Targets and StoplossPlease take a brief overview of the UNI versus USDT chart for 1 day.
All information is included in the chart.


UNIUSDT | PARALLEL CHANNELUNIUSDT has been trading in bullish channel .
The price has approached to the lower boundary of channel. The bulls need to hold this important support .
The break below will bring bears in control .
Manage your trades accordingly.

Long uni @ 7.1950, target 7.7350 stop 6.6588Entered on pullback this morning.
Targeting downsloping trendline around $7.7
STOP UNDER 19 OCT HIGH.
RISK REWARD 1:1

#UNI/USDTTrade setup: After two rejections, price finally broke above 200-day moving average (SMA200) and reached $7.50-8.00 resistance zone. Now wait for price to 1) break above $8 to resume an Uptrend or 2) pull back near $6 support. (set a price alert). Short- and Medium-Term trend has inflected bullish again. Uniswap remains the biggest DEX, as mentioned in a recent report .
Trend: Uptrend on Short- and Medium-Term basis and Neutral on Long-Term basis.
Momentum is Bullish ( MACD Line is above MACD Signal Line and RSI is above 55).
OBV (On Balance Volume): is flat, indicating that volume on Up days is equal to volume on Down days. Hence, demand from buyers and supply from sellers are in equilibrium
Support and Resistance: Nearest Support Zone is $6.00, then $4.75. The Nearest Resistance Zone is $7.50 - $8.00, then $10.00.

BINANCE: UNI/USDT (Still above critical support)Despite all the negative news and awful charts UNI held it strongly above the support level of 5.75$. price moves in a falling wedge and breaking out of this pattern will be bullish. This will only fail if Bitcoin decides to go other way. This will cause this setup fail most probably but i will add more spot buy if market gave me the 4$ buying opportunity.
always DYOR before taking any financial decisions.
Cheers
🛒 Pair: UNI/USDT 🛒
== SPOT==
⏰ 1401/07/03 ⏰
🕰 25/09/2022 🕰
Duration:
📈 SCALP - SHORT 📈
Ex: Binance
#95
🛒 Buy : 5.70 - 5.90 🛒
👉Sell Targets👈
🎯TP1: 6.20 🥉
🎯TP2: 6.70 🥈
🎯TP3: 6.95 🥇
🎯TP4: 7.20 🚁
🎯TP5: 7.70 ✈️
🎯TP6: 9.00 🚀
🎯TP7: 9.50 🛸
🎯TP8: 10.50 ✨
🎯TP9: 12.00 💫
⛔️ SL: 5.10 by closing H4 below

UNIUSDT is creating an inverse head and shouldersThe price bounced on 5.14 Daily support after a double top at 9.5$
Now the price is creating an inverse head and shoulders on the daily timeframe and the price is testing the dynamic daily resistance.
How to approach it?
IF the price is going to have a breakout and retest the resistance as new support, According to Plancton's strategy , we can set a nice order
–––––
Keep in mind.
🟣 Purple structure -> Monthly structure.
🔴 Red structure -> Weekly structure.
🔵 Blue structure -> Daily structure.
🟡 Yellow structure -> 4h structure.
⚫️ black structure -> <= 1h structure.
–––––
Follow the Shrimp 🦐
UNISWAPuni been moving inside this bearish channel
looking to scalp it up an down
SL to protect your self please
peace
💡Don't miss the great buy opportunity in UNIUSD @UniswapTrading suggestion:
". There is a possibility of temporary retracement to the suggested support line (7.38).
. if so, traders can set orders based on Price Action and expect to reach short-term targets."
Technical analysis:
. UNIUSD is in an uptrend, and the continuation of the uptrend is expected.
. The price is above the 21-Day WEMA, which acts as a dynamic support.
Take Profits:
TP1= @ 7.77
TP2= @ 8.17
TP3= @ 8.74
TP4= @ 9.57
TP5= @ 10.08
SL= Break below S2
❤️ If you find this helpful and want more FREE forecasts in TradingView
. . . . . Please show your support back,
. . . . . . . . Hit the 👍 LIKE button,
. . . . . . . . . . Drop some feedback below in the comment!
❤️ Your support is very much 🙏 appreciated!❤️
💎 Want us to help you become a better Forex / Crypto trader?
Now, It's your turn!
Be sure to leave a comment; let us know how you see this opportunity and forecast.
Trade well, ❤️
ForecastCity English Support Team ❤️

💡Don't miss the great buy opportunity in UNIUSD @UniswapTrading suggestion:
". There is a possibility of temporary retracement to the suggested support line (7.38).
. if so, traders can set orders based on Price Action and expect to reach short-term targets."
Technical analysis:
. UNIUSD is in an uptrend, and the continuation of the uptrend is expected.
. The price is above the 21-Day WEMA, which acts as a dynamic support.
Take Profits:
TP1= @ 7.77
TP2= @ 8.17
TP3= @ 8.74
TP4= @ 9.57
TP5= @ 10.08
SL= Break below S2
❤️ If you find this helpful and want more FREE forecasts in TradingView
. . . . . Please show your support back,
. . . . . . . . Hit the 👍 LIKE button,
. . . . . . . . . . Drop some feedback below in the comment!
❤️ Your support is very much 🙏 appreciated! ❤️
💎 Want us to help you become a better Forex / Crypto trader ?
Now, It's your turn !
Be sure to leave a comment; let us know how you see this opportunity and forecast.
Trade well, ❤️
ForecastCity English Support Team ❤️

📈✌UNI Daily analysis✌📉BINANCE:UNIUSDT
COINBASE:UNIUSD
First, please take a look at my previous analysis and positions.
between now and the yellow areas, you can open a long position in two steps.
If the price rises and reaches the risk-free level, you can risk-free the position.
TP1-2-3-4-5-6 are on the chart.
The optimum stop-loss is on the chart.
Please share ideas and leave a comment,
let me know what's your idea.
CrazyS✌

Double bottom is in progressDouble bottom is in progress, I see a target of the coin in this season, more than 500.
