UNI MULTIPLE PATTERNSUNI Symmetrical Triangle DTF.
Bull target top of the range and Bear target bottom of the range.
Ascending Triangle leading up to the mid range, lets see if we can break the MID RANGE for continuation.
Nice simple trading setup for long or short trade.
UNIUST trade ideas

Uni Will Dump Moreas you can see Uni is rejected its supply zone daily and also broken dynamic support, it seems in 1h engulfing is happening, it shows more dump is on the way,
my chart is clear, focus on that you will get everything...
I consider all analyses performed in relation to that trade position.
Our analysis is not a buy or sell referral.
If you found our analysis useful and interesting, feel free to share it so that more individuals might benefit from it.
And please don't forget to like and comment; we will read them all.

UNI POTENTIAL SELL SET UPAfter Uni took liquidity on our demand orderblock at $5.5-5.7 and long position is up 13% on 1x, will be looking at the reaction at $6.85 for a possible sell, will ladder orders between 6.85-$7 and cut profits down to $6, if it doesnt play out, will cut at $7.2, all risk involved is less than 5% and traders advised to manage risk and not use more than 5-7x as leverage, also not more than portfolio risk size, also reminder that our previous long is up 13% already. so RR is good.......

🟢 UNIUSDT - 1D (22.09.2022)🟢 UNIUSDT
TF: 1D
Side: Long
Pattern: Bull Pennant / Falling Wedge
Leverage: 5x
SL: $4.7202
TP 1: $6.2473
TP 2: $6.9297
TP 3: $7.4812
Looks like it wants to make powerful moves soon.


UNIUSDT 4H Time Frame.As can be seen, in the 4-hour time frame, the price is completing the correction. According to Elliott's theory, we are now in wave 3 of this correction, and if all five waves of this correction are completed, a buying position can be taken in the price range of $5.5 to $5.56. .
Thank you very much for your attention.

UNI/USDT 9% move towards downside expected, selling uni here. UNI/USDT is clearly rejected from its resistance, also broke its trendline and retested it.
clear H&S is in progress, once it is broken, it will test 6.00 area, so initial TP is set at 6.00.
BEST OF LUCK!!

UNI LONGWhat I see from the price in the daily time frame is a strong upward movement.
Price correction up to the 50% Fibonacci area, which coincides with the static support area .
What I expect is the end of the correction and the beginning of the upward movement .
UNIThe price has formed a rising wedge and several bearish signals - a slight correction is possible after breaking through the lower border of the pattern

UNI Mid term speculationmiddle term speculation based on fibonacci and price action. Might be tradeable but not an indication

UNI/USDTUNI/USDT
It is in a descending channel.
An inverted head and shoulder is formed.
In my opinion, it can increase the price up to the ceiling of the channel.
#UNIUSDT #UNI #BTCUSDT #BTC #ETHUSDT #DOGE #DOGEUSDT

UNİ⚡⚡ #UNİ/USDT ⚡⚡
Exchanges: Binance Futures
Signal Type: Regular (Long)
Leverage: Cross (20X)
Entry Zone:
1) 6.07
2) 5.96
3)
Take-Profit Targets:
1) 6.28
2) 6.43
3) 6.54
4) 6.66
Stop Targets:
1) 5.79
Trailing Configuration:
Entry: Percentage (0.5%)
Take-Profit: Percentage (0.5%)
Stop: Moving Target -
Trigger: Target (1)

UNIUSDTHello Dear friends
In the four-hour period, the negative divergence of the RSI has been issued to us, but we do not have another signal to form a corrective trend!
And as long as the upward trend line is maintained and the movement trend is not placed below the price range of $6.39, the probability of breaking the resistance range of $7.25 is high.
We would be happy to hear your comments


4h harmonic pattern UNIEntry price :6.891
Stop Price : 7.290
Take Price : 6.593
RSI : 68.47
RSI Divergence : Yes
UniswapIf Uniswap daily candle breaks the support line and closes under 6.55$, the price will continue falling

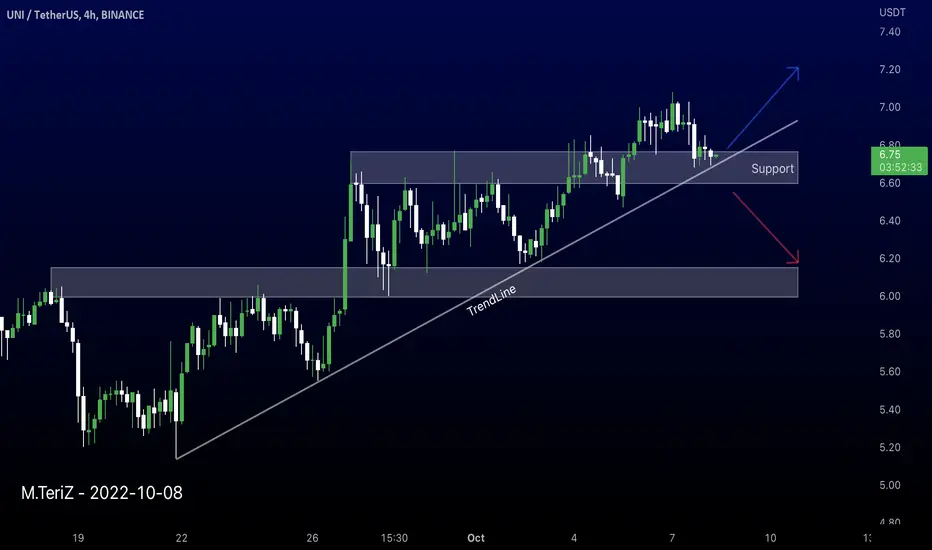
UNIusdt 4H TrendLine support According to the trend line, we expect the price to increase from the specified level, otherwise, the fall will become stronger with the failure of the support zone.
Its not Buy or Sell SIGNAL
DYOR
BY : M.TeriZ - @AtonicShark
176.47% Profit with this suggestion / UNIUSDTWow! Nice! 176.47% Profit.
TP1: 6.35 ✅
TP2: 6.6 ✅
TP3: 6.9 ✅
TP1, 122.55% (5x). TP2, 147.06% (5x). TP3, 176.47% (5x) 😍👍
See my previous idea!
Did you buy it too?
What is your experience?
Follow me! Copy my trade!
TradeSetup_Reza

UNI/USDTZone by short possition on the prder block 1w, resistance in white 1w, resistance in red 1d. Fowol level BTC 💯

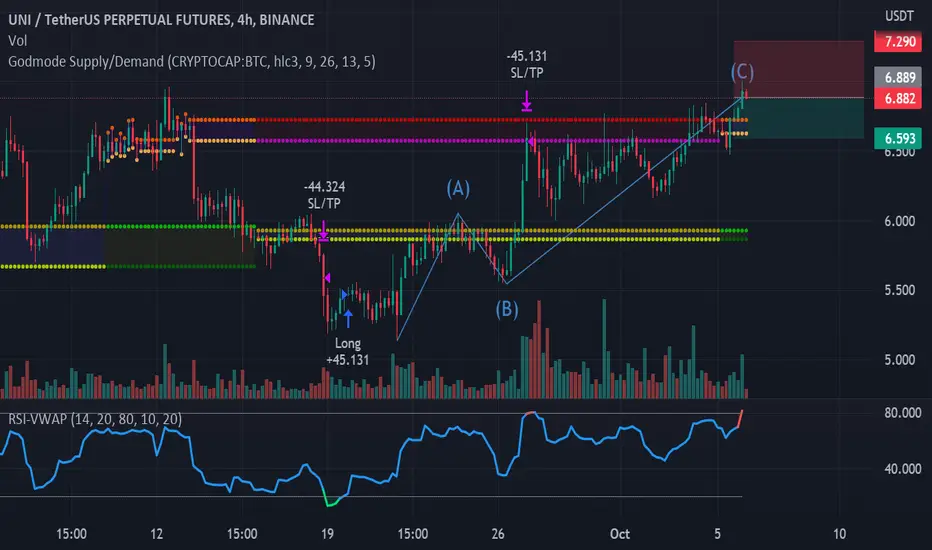
UNI/USDT A detailed Elliot Wave count.Wave 1: looks like a leading diagonal.
Wave 3 > Wave 5
So count is still valid.
Wave 2: A simple ABC correction.
Wave 3: An impulse wave up with an extended 3rd wave and a 5th truncated.
Wave 4: Looked to me like an ascending triangle ABCDE correction.
but I'm not entirely sure.
Wave 5: Forming at the moment.
in the internal count wave 3 looks small and short to me, which may be an ending diagonal with a 5th wave < wave 3
I would love to see a rising wedge pattern for a short opportunity on this one.
If something is incorrect or you have any comment on my analysis I would love to get some feedback.

UNIThe price has formed a rising wedge and may start a correction. Bearish divergences formed, candle color indicates overbought

Bullish on $UNIBullish Wolfe Waves on lower time frames of Uniswap's charts. Worth punting a long imo.
Entry might not be the best.
Targets marked in green lines all the way up to HTF supply (smallest portion of the position should be left after first two targets are booked and secured).
Stop loss below the sweep of the lows.
Use adequate position sizing and risk management.

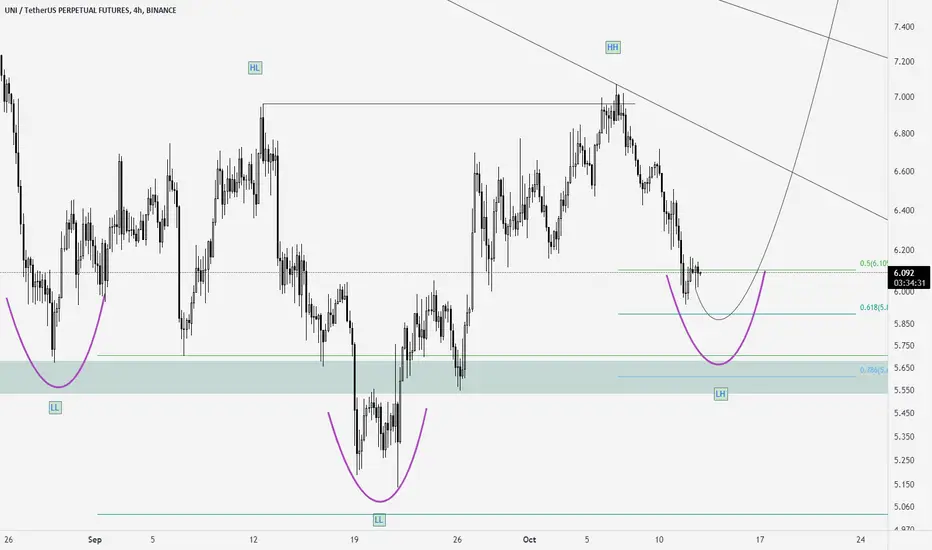
📚Learn More💰Earn More - Inverse Head and Shoulders in UNIUSD📚 LEARN MORE
💰 EARN MORE
Inverse Head and Shoulders Definition:
A head and shoulders pattern is also a trend reversal formation.
It is formed by a Valley (left shoulder), followed by a Lower Valley (head), and then another Higher Valley (right shoulder).
A “Neckline” is drawn by connecting the highest points of the two Peaks. Neckline resistance does not need to be strictly horizontal.
This illustrates that the downward trend is coming to an end.
When a Head and Shoulders formation is seen in a downtrend, it signifies a major reversal.
The pattern is confirmed once the price breaches the neckline resistance.
In this example, we can easily see the head and shoulders pattern.
How to Trade the Head and Shoulders Pattern:
ENTRY:
we put an entry order above the neckline.
TARGET :
We can also calculate a target by measuring the lowest point of the head to the neckline.
This distance is approximately how far the price will move after it breaks the neckline.
❤️ If you find this helpful and want more FREE forecasts in TradingView
. . . . . Please show your support back,
. . . . . . . . Hit the 👍 LIKE button,
. . . . . . . . . . Drop some feedback below in the comment!
❤️ Your Support is very much 🙏 appreciated!❤️
💎 Want us to help you become a better Forex trader?
Now, It's your turn!
Be sure to leave a comment let us know how you see this opportunity and forecast.
Trade well, ❤️
ForecastCity English Support Team ❤️
